Words: 1613 | Estimated Reading Time: 9 minutes | Views: 141
The buyer profile in the 5 central wards has moved up across the board, but the average inquiry price of JPY 344 million is still less than half of the actual average listing price.
1. With 10-year JGBs at 2.4%, "central Tokyo" is being repriced
To understand the price of central Tokyo assets, first identify the reference asset. According to Jiji Press, the Ministry of Finance set the coupon on the April issuance of 10-year JGBs at 2.4%, the highest in 28 years and 8 months. This matters because it sets the opportunity-cost floor for all income-producing real estate.
In other words, with the risk-free rate at 2.4%, a core-city building delivering only a 3% headline gross yield (gross cap rate) offers investors less than one percentage point of risk premium. This isn’t about “cheap” or “expensive”; the pricing logic has shifted from cash-flow harvesting to capital preservation.
For cross-border investors, recalibrate your frame of reference. In China’s Tier-1 cities, office/retail cash yields are thin and realization depends on appreciation; in central Tokyo, low yields are not a product of excess liquidity but of being back-solved from a 2.4% long-bond rate—firmer support and less upside elasticity.
Meanwhile, demand has not retreated. On September 4, Meiji Yasuda Life announced at the completion ceremony of its new Shinjuku building that it would double its investment real estate balance from roughly JPY 950 billion to about JPY 2 trillion by 2040, citing “rents are rising.” When long-duration domestic capital like life insurers overtly doubles down, the yield ceiling on core assets is pressed from above.
Such capital ignores short-term price moves and focuses on the long-run rent curve; once in, it rarely sells. This means the float will thin further in core station areas, leaving individual investors to compete mainly for what remains after institutional screening.
2. What does JPY 344 million actually buy?
A September 4 survey by Kenbiya breaks down inquiry user profiles over the past year (Aug 2025–Jul 2026) across the 5 central wards (Chiyoda, Chuo, Minato, Shinjuku, Shibuya). The conclusion is straightforward: the buyer base has shifted up a notch.
Among those inquiring about properties in the 5 central wards, 48.8% report annual income above JPY 15 million, versus 27.8% nationwide; above JPY 20 million, it is 35.4% versus 16.6% nationwide. Company employees remain the largest cohort (about half), but executives rise from 16.2% nationwide to 21.3% in central Tokyo, and doctors/lawyers/accountants from 3.1% to 5.1%.
Notably, the occupational mix has barely changed; what shifted is the income quantile within each occupation. In other words, the 5 central wards have not become a “professional buyer market.” It remains the battleground of high-salaried employees—just the leading edge of that group.
The true divergence is inquiry price. For company employees, the average inquiry price in the 5 central wards is JPY 344 million, 5.9x the national average for the same occupation; for professional real estate operators it is the highest at JPY 624 million (6.9x nationwide); the most dramatic is the self-employed, from JPY 49 million nationwide to JPY 354 million centrally, a 7.3x jump.
Conversely, doctors/lawyers/accountants average about JPY 180 million—the lowest among major occupations and only 2.0x the national figure. They are effectively looking at the same product tier centrally and peripherally, indicating a portfolio-allocation approach rather than leveraged operation.
Here is the rub: these numbers, while large, are not high relative to live listings.
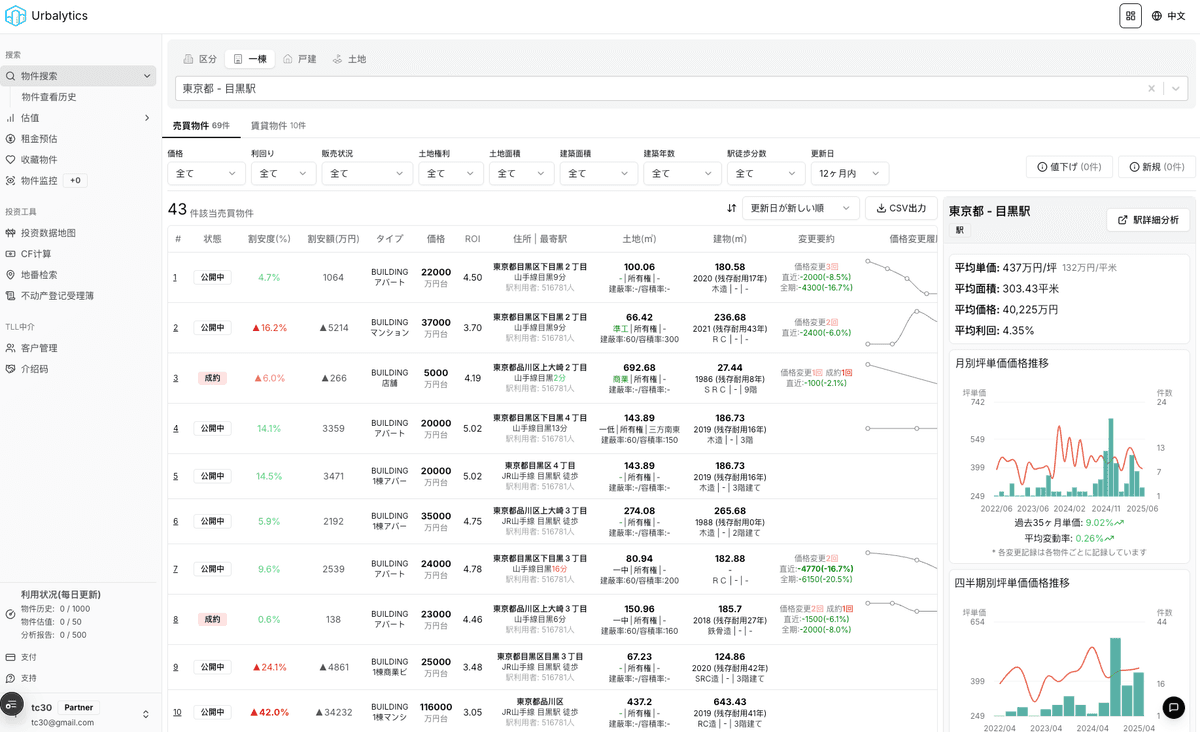
Urbalytics Insight Internal Urbalytics data show that in the Shinjuku station area, 31 whole-building (commercial) listings average JPY 731 million with a median headline gross yield of 4.27%; in Shibuya, 55 listings average JPY 846 million with a median of 3.40%. The JPY 344 million average inquiry price for company employees only reaches about half the actual average asking price.
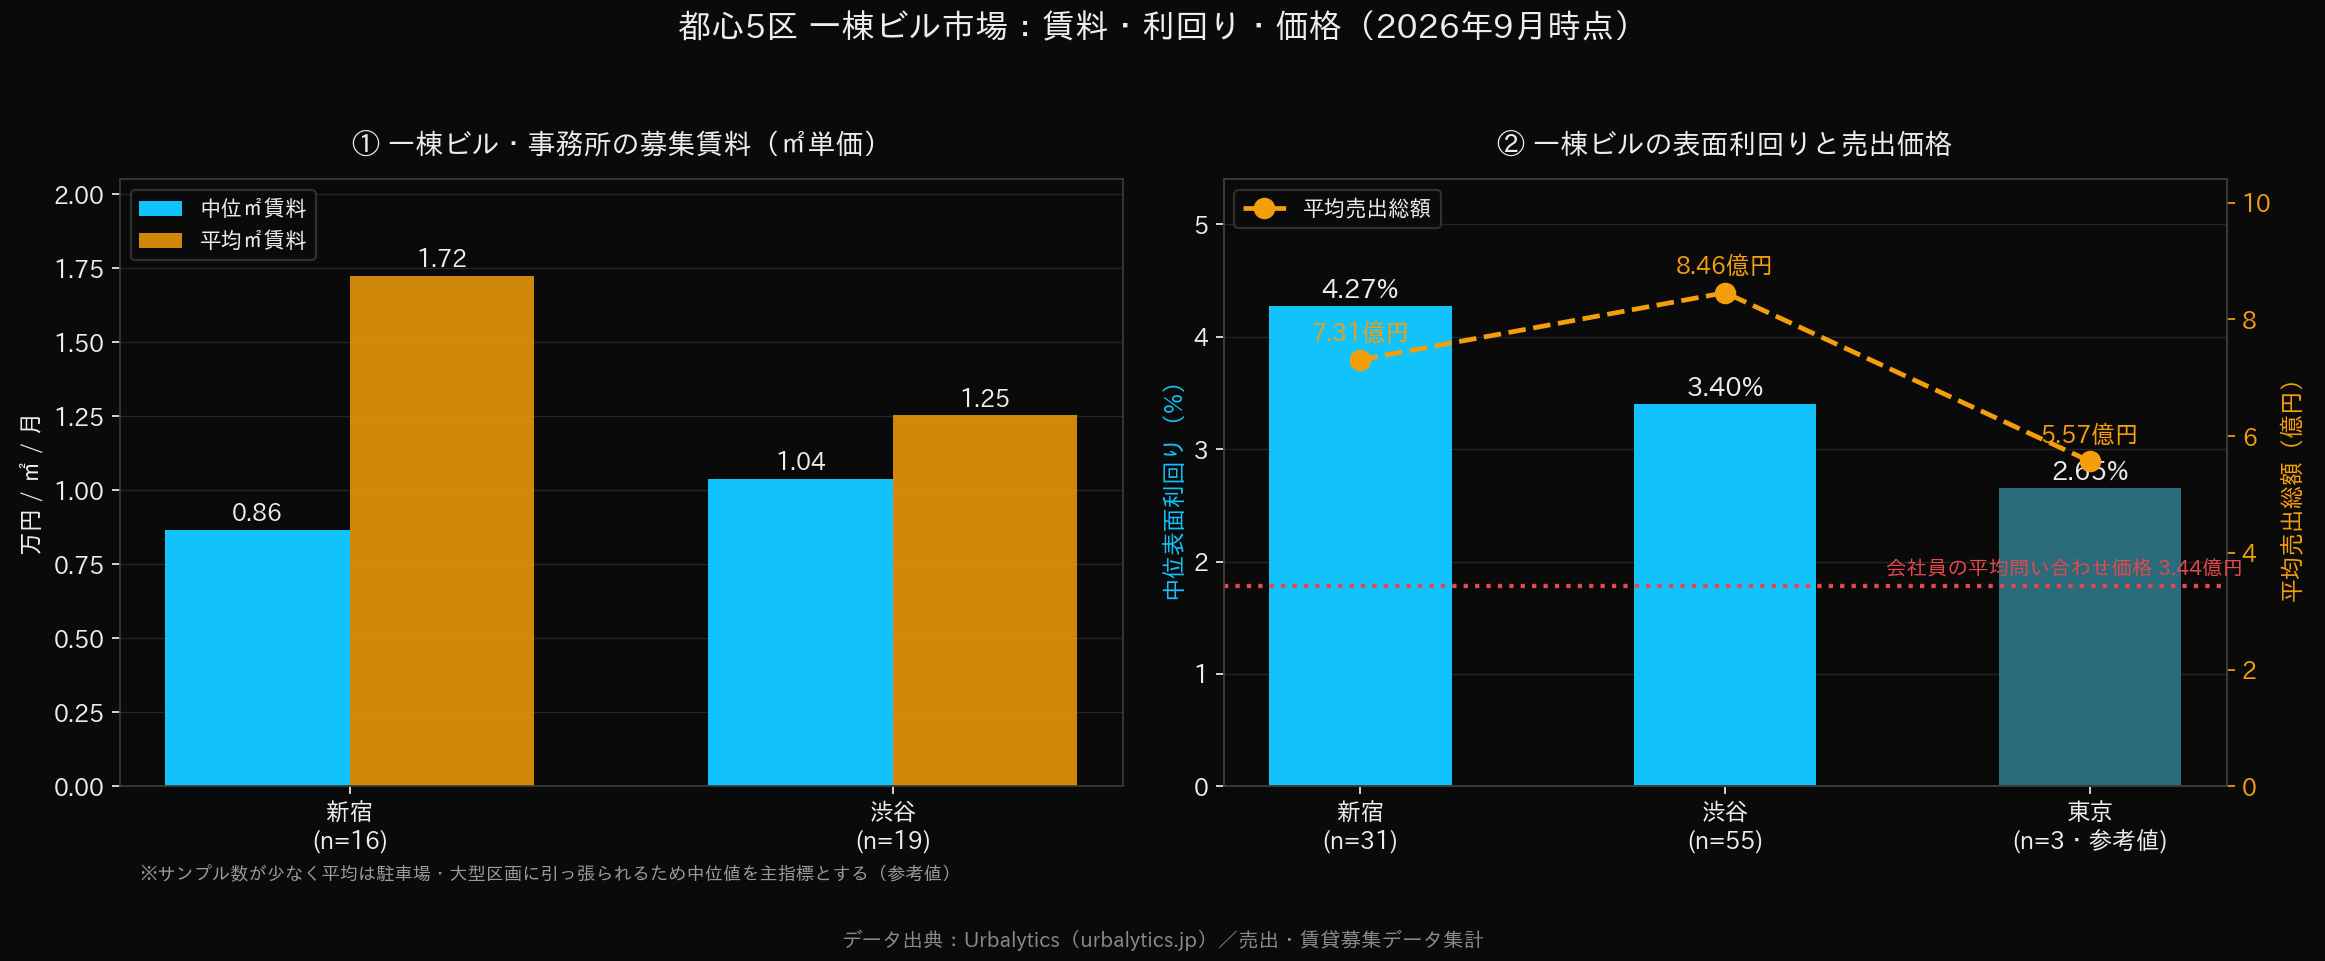
This gap states the obvious: for most high-income individual investors, the so‑called central whole-building market is still one you largely view from the doorway. To actually close, you will need a compromise list in addition to your price budget.
3. Shinjuku, Shibuya, Tokyo Station: three pricings within the same "core"
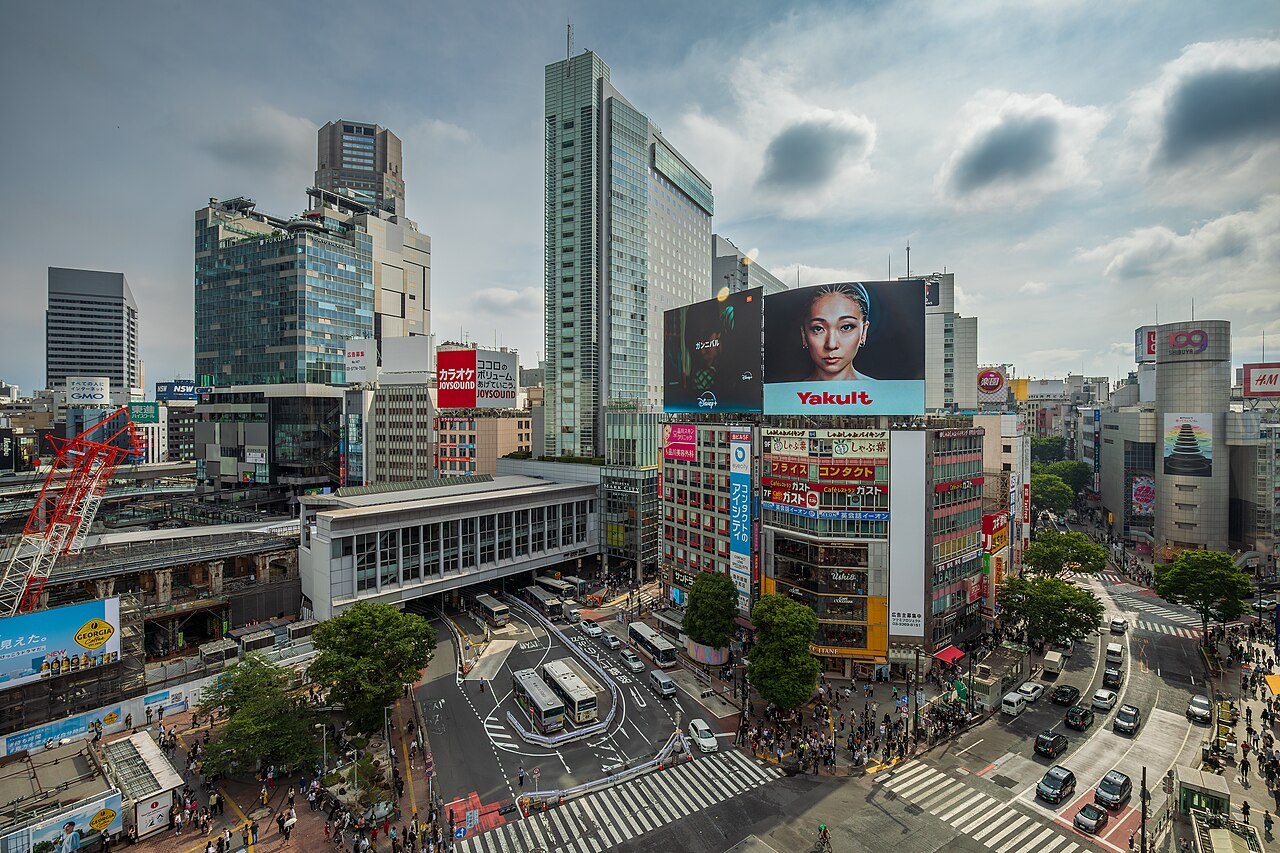
Treating the 5 central wards as one is the easiest but also the riskiest analytical shortcut. In Urbalytics’ station-area data, three representative hubs tell different stories.
Shinjuku’s median headline gross yield is 4.27% (31 samples; average price JPY 731 million; average annual rent about JPY 34.21 million). This is the highest yield among the three, implying the market demands a higher required return for Shinjuku assets—samples around Kabukicho run 6% to 7.8%, at the cost of 1960s–1980s vintages.
Shibuya’s median yield drops to 3.40%, yet the sample count is nearly double Shinjuku’s (55), and the average price is JPY 846 million. Lower yields, more samples, and higher unit prices together typically mean capital is prioritizing this submarket, not that it is deteriorating.
Shibuya is also the most split internally. Some Dogenzaka samples exceed 10% headline yield, while more residential-feel areas like Sarugakucho and Shoto sit around 4.5%. Under a single station name, two distinct markets—commercial arteries and residential streets—share one label.
The Tokyo Station area has only three samples (too few; indicative only), with a median yield of 2.65%. That level is already close to the 2.4% JGB rate, compressing risk premium to around 0.25 percentage point—more like a long-duration bond in physical form than a conventional income investment.
4. Demand bifurcation: why high earners shift from "units" to "whole buildings"
Kenbiya’s survey adds a more actionable clue: as income bands move up, asset category choice shifts structurally.
Among company employees around the JPY 10 million band, 64.2% inquire about condominium units; among doctors/lawyers/accountants, 55.2%. Above JPY 50 million income, whole-building assets—commercial and entire residential—rise to around 80%, with units typically dropping to roughly 10%.
The underlying reason is straightforward: the issue with units is not yield, but scale ceilings and financing efficiency. A high-end central unit often costs over JPY 100 million but delivers limited rent cash flow; land rights are diluted, and banks rate them below whole-building collateral.
Above JPY 50 million income, preferences split into two camps:
First, company employees (56.9%), self-employed (55.5%), and professional real estate operators (64.8%) mainly choose whole-building commercial assets, pursuing rent elasticity and re-rating potential from commercial leases, with greater vacancy and capex volatility as the trade-off.
Second, corporate executives (39.2%) and doctors/lawyers/accountants (52.9%) favor entire residential buildings; residential leases offer steadier cash flow and lighter management—suited to busy professionals treating property as allocation rather than an operating endeavor.
Professional real estate operators are the most consistent: from 45.5% at the JPY 10 million band to 64.8% above JPY 50 million, concentration in whole-building assets keeps rising. The more one earns a living in the sector, the less one diversifies—an implicit vote for commercial buildings as an asset class.
One more detail: even above the JPY 50 million band, the self-employed (25.5%) and corporate executives (22.9%) still retain 20%+ inquiries in units, with average ticket sizes around JPY 97 million and JPY 152 million respectively—high-priced units in the core have not been fully abandoned by large checks.
5. Outlook and investment takeaways
Viewed together, the central 5 wards’ H2 2026 setup is clearer. On the capital side, long-duration money such as life insurers intends to double allocations, capping the yield ceiling on core assets. On rates, the 2.4% long bond pushes from below, thinning safety margins on low-yield assets. The result is prices that rise more easily than they fall, with almost no room for yield improvement.
For individual investors, the anchor to reset is expectations. JPY 344 million is a large ticket nationwide but only half the average in core station areas. To enter this market, either build compromises on vintage, micro-location, or scale into your model in advance, or look to station areas still yielding above 4%.
From this angle, the 0.87 percentage point gap between Shinjuku’s 4.27% and Shibuya’s 3.40% is a pricing sheet: it marks how much yield the market is willing to give up for “better location and newer stock.” Deciding which side you belong on is far more useful than arguing whether the core is cheap or expensive.
Risk notice A reminder on rents: Urbalytics whole-building/office leasing data show median rent around JPY 8,650 per m² in Shinjuku and JPY 10,390 per m² in Shibuya, but Shinjuku’s tsubo asking trend over the past four quarters is -15.4% (only 16 samples; indicative). With yields already compressed to the 3%–4% band, if rents do soften, price cushions will be very thin. Also, a non-trivial share of samples are from the 1960s–1980s; plan for capex and seismic costs up front.
The bottom line: the central 5 wards are not a market you can summarize as “cheap” or “expensive”; they stratify buyers automatically by capital size. The real question is not whether to buy the core, but which tier your capital fits and whether that tier’s pricing is reasonable now. To see yield distributions, rent levels, and live listing samples by station area before you place a bid, run a comparison on Urbalytics.
#TokyoCentralFiveWards #Shinjuku #Shibuya #Chiyoda #Minato #WholeBuilding #GrossYield #JapanRealEstateInvestment #IncomeProperty #CondominiumUnit #TokyoOffice #caprate #LongTermRates #InvestorProfile #Urbalytics
References
- Kenbiya Co., Ltd., “Survey of prospective real estate investors in the 5 central wards: About half report annual income of JPY 15 million or more; company employees’ average inquiry price reaches JPY 344 million, 5.9x the national level.” September 4, 2026 — https://www.kenbiya.com/ar/ns/research/kenbiya_report/10494.html
- Jiji Press, “Meiji Yasuda to double real estate investment.” September 4, 2026 — https://news.yahoo.co.jp/articles/15cad469dfbbbc73bab8aef01348cfbcef5c4866
- Urbalytics (urbalytics.jp), aggregated for-sale and leasing data (whole-building yields and rent statistics, as of September 2026) — https://www.urbalytics.jp