
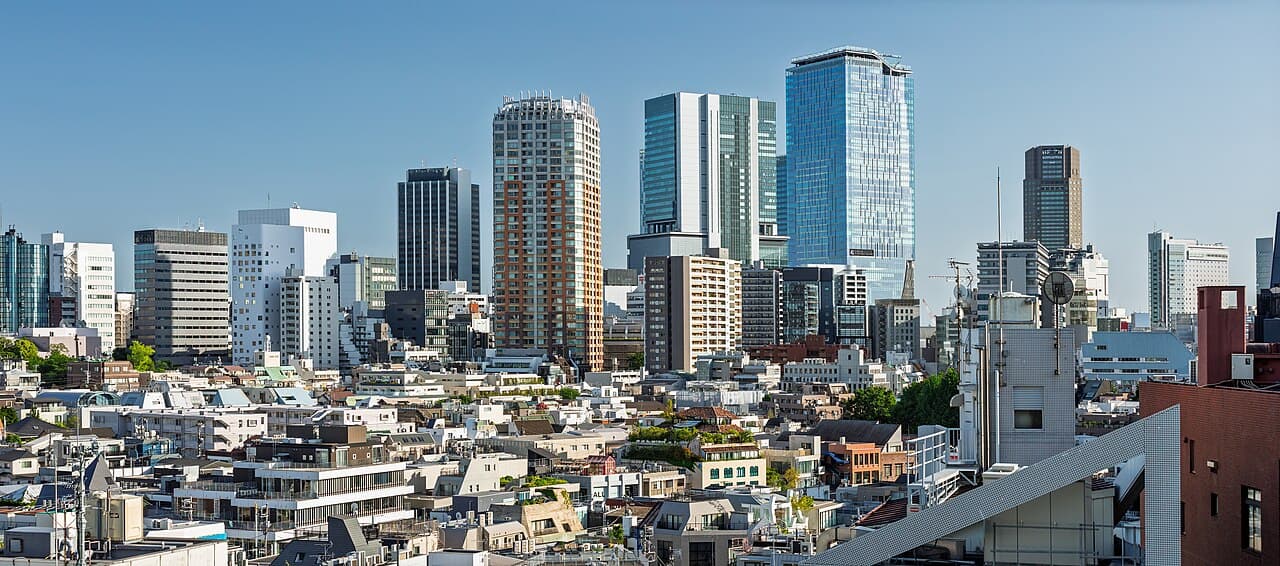
Words: 1042 | Estimated Reading Time: 6 minutes | Views: 109
Greater Tokyo Area Rents Hit a New High; Divergence Across Five Stations
According to data released on September 16 by Tokyo Kantei (TOKYO KANTEI, a Japanese real estate research firm) on August 2026 rents for for-sale condominiums across the three major metropolitan areas, the Greater Tokyo Area’s average asking rent reached ¥4,242/㎡, up 0.8% m/m, the third consecutive monthly rise and the highest level in roughly a year. Tokyo Metropolis averaged ¥4,985/㎡—just shy of ¥5,000.
Investment decisions in the capital region shouldn’t stop at prefectural averages. Using urbalytics’ rent_stats to drill the same prefecture and asset type down to the station level, five representative hub stations show clear divergence.
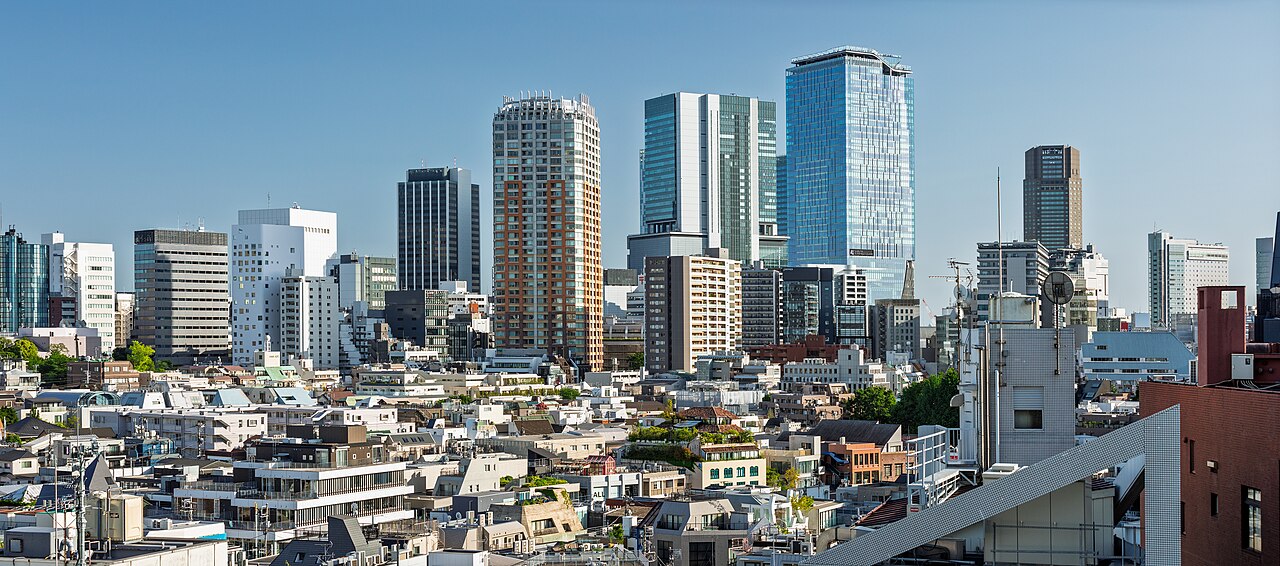
I. Source data: Three of four prefectures hit a one-year high
Tokyo Kantei’s figures are based on asking rents for for-sale condominiums when leased, converted to per-㎡ terms, covering listings across major administrative areas in the Greater Tokyo Area (Tokyo, Kanagawa, Saitama, Chiba).
August highlights:
Greater Tokyo average: ¥4,242/㎡ (+0.8% m/m), up for three straight months, a near one-year high.
Tokyo Metropolis: ¥4,985/㎡ (+0.4%), up for three straight months and just ¥15 below ¥5,000. High-priced samples in the core five wards (Chiyoda, Chuo, Minato, etc.) continue to support the average.
Kanagawa: ¥2,910/㎡ (+0.6%), continuing to rise, a near one-year high.
Saitama: ¥2,409/㎡ (+1.7%), the largest m/m increase, also a near one-year high.
Chiba: ¥2,230/㎡ (-0.4%), down for five consecutive months. The driver is fewer newer units (completed within 7 years) among higher-rent wards in Chiba City.
From the same monthly report one can read both “Greater Tokyo rents at a record” and “Chiba down five straight months.” The key is the level of granularity.
Source: R.E.port 2026/9/16 “Greater Tokyo rents for for-sale condos hit the highest level in roughly a year” / original data by Tokyo Kantei, “Monthly trends in rents for for-sale condominiums across the three major metropolitan areas (Aug 2026).”
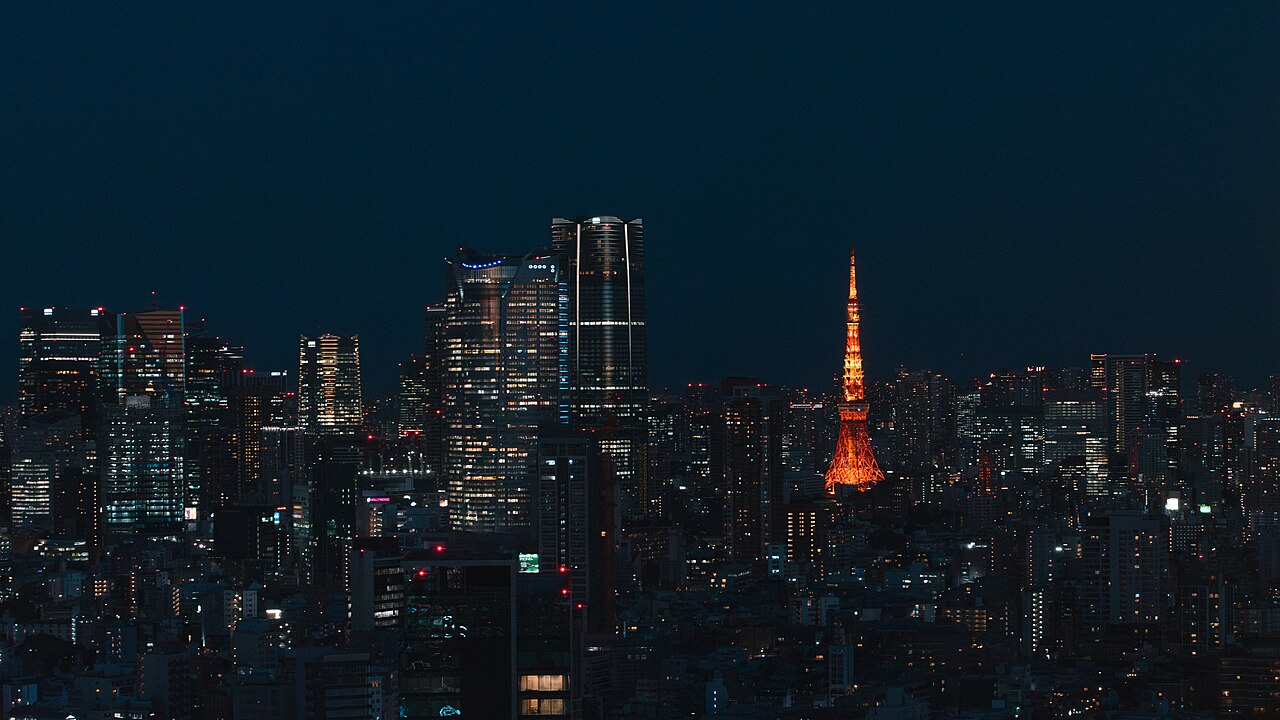
II. urbalytics station-level data: Divergent trends and sample-size differences across five stations
Breaking Tokyo Kantei’s prefectural averages down to five representative hub stations on urbalytics, the past five quarters of unit rent per tsubo are as follows. Data: urbalytics rent_stats, property type = condominium, trendUnit = quarter, past one-year range. Note: 1 tsubo ≈ 3.3 ㎡.
Station Sample size Unit rent per tsubo (1 year ago) Latest unit rent per tsubo Overall change Shibuya 500 ¥21,300 ¥21,100 -0.94% Shinjuku 168 ¥24,500 ¥17,700 -27.76% Shinagawa 333 ¥23,800 ¥19,000 -20.17% Yokohama 473 ¥16,100 ¥12,700 -21.12% Osaki 382 ¥19,600 ¥16,900 -13.78%
“Latest” is 2026 Q3 (four-week rolling average through early September); “1 year ago” is the same period in 2025 Q3. Source: urbalytics rent_stats (property type = condominium, trendUnit = quarter, past one year).
The most valuable information here is not only the rate of change, but also the sample size.
Sample size reflects the number of listed rental condominiums at that station. A 500-unit Shibuya versus a 168-unit Shinjuku rests on very different statistical footing. Where samples are larger, outliers have less impact on the average and the series is more stable; where samples are small, averages swing more with individual listings.
Shibuya is the most stable. Its 500-sample size is the largest among the five, and the -0.94% dip is statistically close to flat. This suggests Shibuya-area condo rents were broadly unchanged over the past year, broadly in line with Tokyo’s overall upward trend.
Shinjuku has the fewest samples, just 168. With a small sample and shifts in listing mix across quarters, average moves can be amplified. The -27.76% in Shinjuku should be read alongside sample size: it does not mean rents truly fell by nearly one-third; rather, mix shifts drove volatility in the calculated average.
Shinagawa (333) and Osaki (382) sit mid-pack in sample size and data reliability. Yokohama (473) is close to Shibuya in sample size, yet the -21.12% move remains large—evidence that the distribution of listing prices in Yokohama materially shifted over the past year.
For investment decisions, the takeaway is straightforward: when selecting stations, sample size itself is a proxy for market depth. Stations with larger samples have deeper rental markets, better liquidity, and more reliable averages.
III. Implications for investment decisions
1. Shibuya is the most rent-stable among the five. A 500-sample and near-zero change indicate a stable demand structure. If you hold condos around Shibuya completed in or after 2015, you can raise your expectation for rent stability.
2. Be extra cautious with change rates where sample sizes are small. Shinjuku’s 168 samples mean averages are sensitive to individual listings. In screening, don’t look only at change-rate rankings—use sample size as a second filter. Stations with stable sample sizes and small moves provide the most reliable signals.
3. The Greater Tokyo market is in an upward rent trend. Tokyo Kantei’s prefectural averages have risen for three consecutive months, with three of four prefectures at near one-year highs. Station-level data don’t negate the trend—they show that beneath it, market depth and volatility differ by station. Picking stations matters more than timing.
IV. Tracking this with urbalytics
urbalytics’ rent_stats provides quarterly trends at four levels—station, ward, city, prefecture—and supports slicing by property type (condo/single-family/with land), by floor-area band, and by completion-year band.
Suggested monthly review workflow:
First, check the target station’s sample size to judge whether the data foundation is stable.
Then review the tsubo unit-rent change rate in conjunction with sample size. Stations with stable samples (>300 listings) and small moves (<5%) offer the most reliable signals.
If a station shows unusually large changes, switch to finer cuts on urbalytics (by floor-area or completion-year band) to see whether a specific segment is pulling the overall average.
The headline “Greater Tokyo hits a new high” may appear every month. What matters for investment is: which stations are driving that “high”? Is the sample size at your focus stations stable? Reading sample size and change rate together is far more reliable than looking at a single number.
Data sources:
1. R.E.port (2026/9/16) “Greater Tokyo for-sale condominium rents hit the highest level in roughly a year”: https://www.re-port.net/article/news/0000082907/
2. urbalytics rent_stats (property type = condominium, trendUnit = quarter, past one year, five-station samples).
3. Chart “Station-level condo unit rent per tsubo: five-station comparison in Greater Tokyo” generated with matplotlib based on the above urbalytics data.
Copyright: This article is original content by the author. Please do not reproduce, copy, or quote without permission. For usage requests, please contact the author or this site.
Photos in this article: Shibuya Station North 2 ノーマルエディタ/CC BY-SA 4.0(トリミング) Wikimedia Commons·Yokohama Station 20240 Sakura Torch/CC0(トリミング) Wikimedia Commons·Shinagawa Station - Aimaimyi/CC BY-SA 3.0(トリミング) Wikimedia Commons



![[Case 04] Income Building on Yokohama Streetfront|Resold Threefold After Three Months?](/_next/image?url=https%3A%2F%2Fs3.ap-northeast-1.amazonaws.com%2Furbalytics.reins.downloads%2Fblog-images%2F1763600994323-Screenshot%202025-11-20%20at%2010.09.43.png&w=3840&q=75)
![[Case 03] Detached House in Mishuku, Setagaya | Seller with Gradual Price Reductions](/_next/image?url=https%3A%2F%2Fs3.ap-northeast-1.amazonaws.com%2Furbalytics.reins.downloads%2Fblog-images%2F1762780285621-Screenshot%202025-11-10%20at%2022.08.50.png&w=3840&q=75)
![[Case 02] Takada 3-chome, Toshima Ward | Entire Income Building Resold at JPY 220,000,000 — A Twofold Resale Flip](/_next/image?url=https%3A%2F%2Fs3.ap-northeast-1.amazonaws.com%2Furbalytics.reins.downloads%2Fblog-images%2F1762146957221-Screenshot%202025-11-03%20at%2014.00.15.png&w=3840&q=75)