Words: 1400 | Estimated Reading Time: 7 minutes | Views: 119
Among the three most-watched wards in Tokyo’s 23 wards, Setagaya—despite having the lowest rent per square meter—offers a 4.11% gross yield, while Minato, with the highest rents, is only 3.11%.
1. A ranking of "how many times it was viewed," and what it actually means
at home released the 2026 edition of its “Buying & Town Ranking: Tokyo 23 Wards” on September 16. Setagaya retained the overall top spot, followed by Minato and then Shinjuku. After media pickup on September 24, the ranking re-entered Chinese-speaking investors’ feeds.
Definitions matter up front, or the entire conclusion will be misread. This ranking counts the number of page views (PV) on at home for for-sale residential property detail pages during the survey period of May 1 to July 31, 2026. It measures how many times listings were viewed—not how many units sold, and not price levels.
In other words, this is an attention ranking. There is a full decision chain between attention and a buy decision, and each link in that chain can be tested with data.
By audience segment, the order actually splits:
Singles (ワンルーム~1DK): Shinjuku tops the list. Multiple JR lines, Tokyo Metro, Toei Subway, Odakyu and Keio intersect here; the absolute advantage in commute radius outweighs considerations about the living environment.
Couples (1LDK~2DK): Minato ranks first. The high-end residential belt spanning Aoyama, Azabu, Shirokane, and Takanawa, combined with ongoing redevelopment around Toranomon and Shinagawa, underpins a brand premium.
Families (2LDK and above): Setagaya remains No. 1, with Nerima close behind—both are among the most populous wards with complete daily-life infrastructure, but sit a bit farther from the urban core.
The release timing also matters. Data published by Tokyo Kantei on September 24 show that in August, the average asking price of pre-owned condominiums in Tokyo Metropolis (70 m² equivalent) was ¥112.74 million, down 0.2% m/m—the first decline in 28 months; the 23 wards averaged ¥126.77 million, marking a third consecutive monthly drop. Peak attention is arriving just as prices begin to soften.
2. Putting the three wards on the same ruler: rent per m² ordering aligns with the ranking
Rankings alone don’t mean much; you need a yardstick for cross-comparison. Using Urbalytics’ rent_stats, we pulled asking rent data for apartment units at three representative stations—Sangen-jaya (Setagaya), Shinjuku (Shinjuku Ward), and Azabu-Juban (Minato).
By median monthly rent per square meter, the order nearly matches the ranking: Sangen-jaya ¥4,467/m²/month, Shinjuku ¥5,412/m²/month, Azabu-Juban ¥5,803/m²/month. Azabu-Juban is roughly 30% higher than Sangen-jaya.
But the gap in total monthly rent is much larger than in unit price. Azabu-Juban averages ¥369,700 per month, while Sangen-jaya is only ¥151,300—2.4x lower. The reason is unit mix: Azabu-Juban’s average size is 47.58 m² versus just 32.69 m² in Sangen-jaya.
Here’s a common misread worth calling out. To judge whether “rent is expensive,” look at the total; to judge “value for money,” look at rent per m²—Minato’s lead in total rent is half unit price and half larger units.
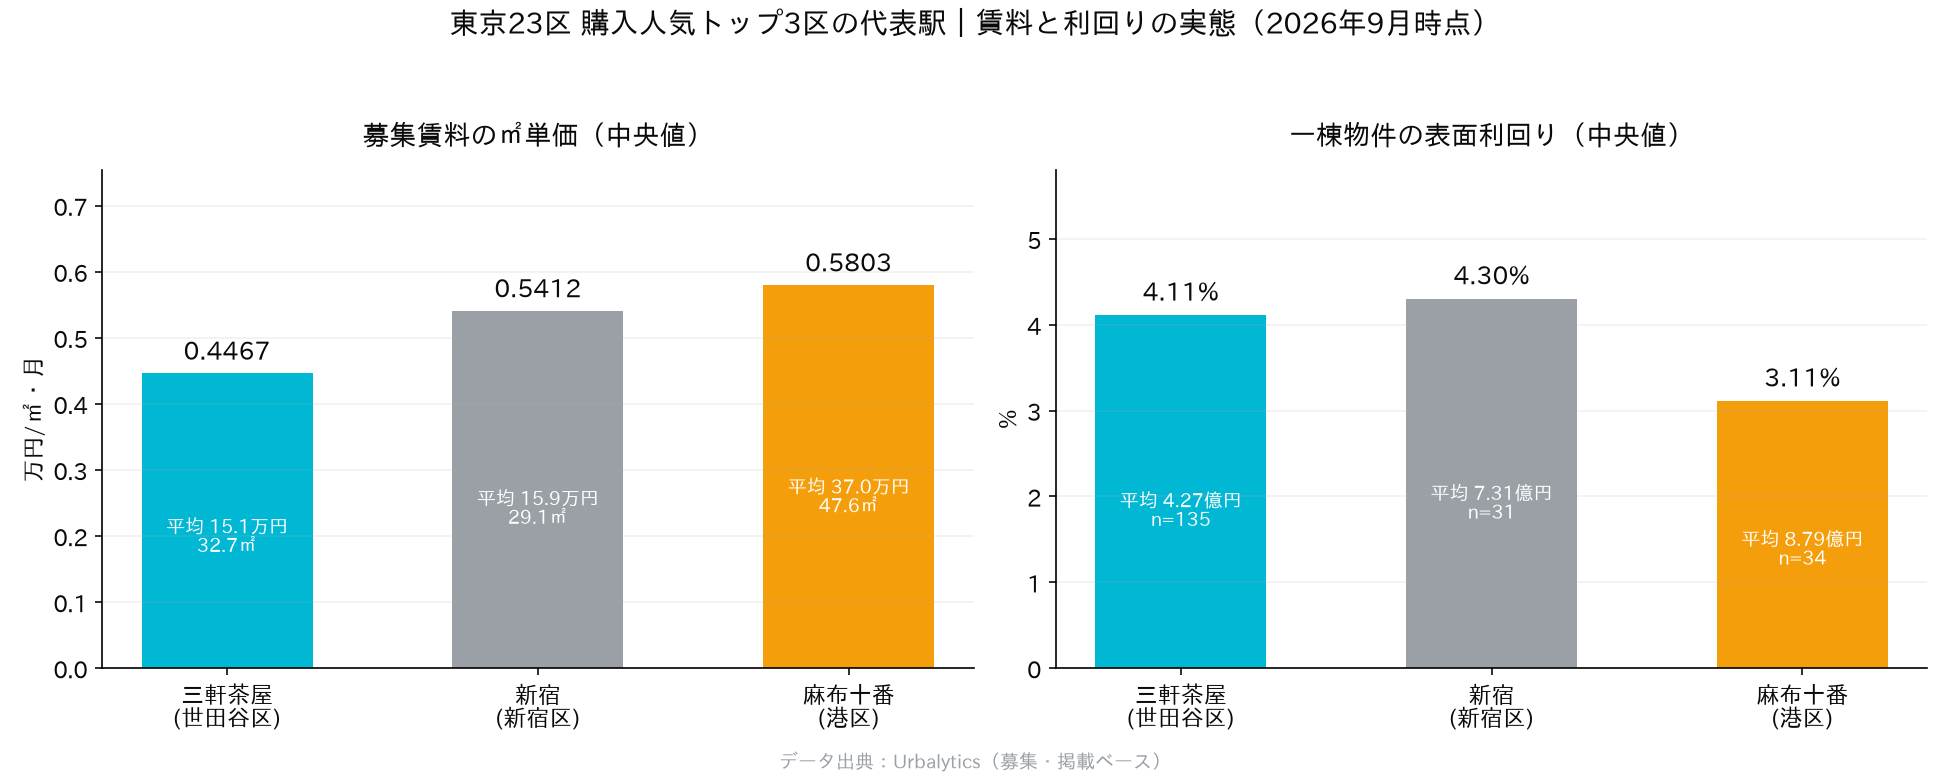
Shinjuku is the most distinctive of the three. Its average unit size is only 29.09 m², the smallest among the three stations, yet its per-m² rent nearly matches Minato. With the highest density of singles-oriented stock, its per-m² rent is pushed into the first tier—precisely corroborating why it ranks No. 1 for singles.
Urbalytics Insight Urbalytics’ asking-rent data show that the per-m² ordering (Sangen-jaya ¥4,467<Shinjuku ¥5,412<Azabu-Juban ¥5,803) closely matches at home’s PV ranking, indicating this “view count” list does capture real demand segmentation. But the unit-price order doesn’t directly translate into return order—that’s what we unpack next.
3. The yield order is the reverse
Switching from rents to the buy side flips the picture. Using building_cap_rate_stats for the same three stations, the median gross yield on whole-building assets is: Sangen-jaya 4.11% (n=135), Shinjuku 4.30% (n=31), and Azabu-Juban only 3.11% (n=34).
In other words, Azabu-Juban’s highest per-m² rents deliver the lowest investor returns of the three. High rents didn’t translate into high returns because the denominator rose faster than the numerator: the average asking price for whole-building assets is ¥879 million in Azabu-Juban, ¥731 million in Shinjuku, and ¥427 million in Sangen-jaya.
The entry-price gap is the most practical dividing line across these wards. With the same ¥880 million budget, you’ll likely buy one building in Azabu-Juban, but two in Sangen-jaya—and each of the latter comes with a full percentage point higher gross yield.
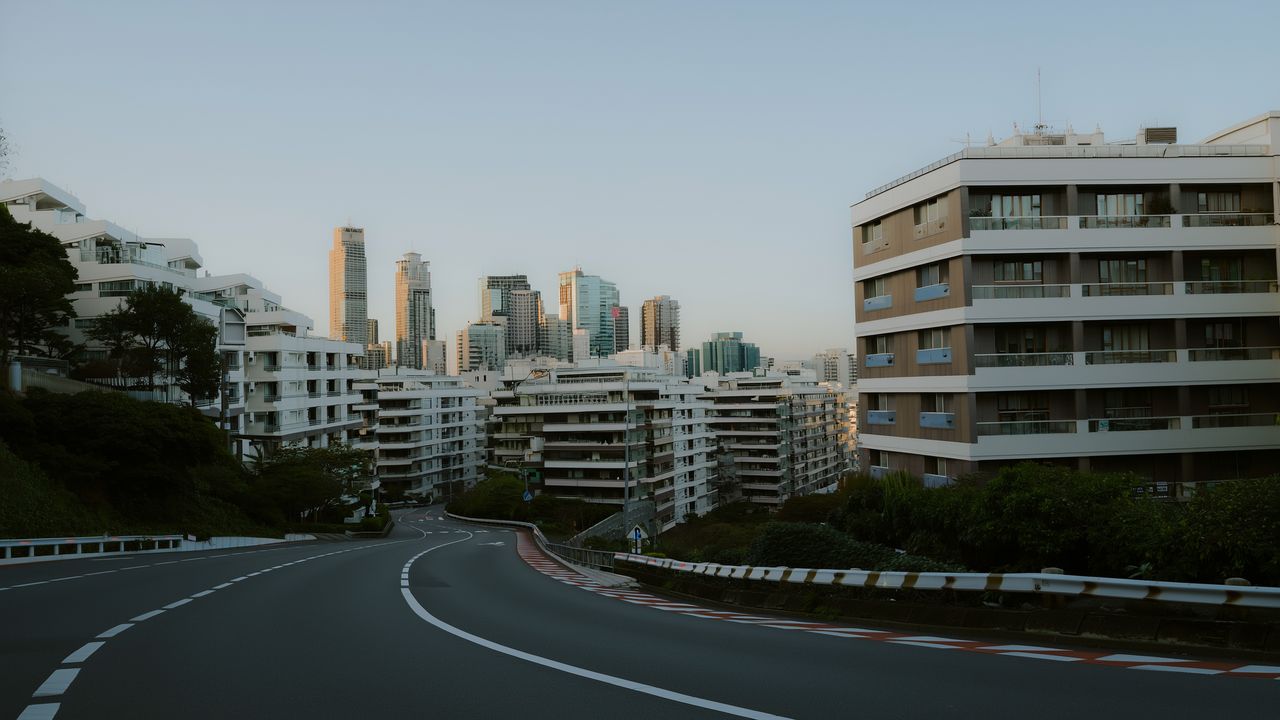
Even more notable is the trajectory of price per tsubo. Urbalytics’ quarterly data show that Sangen-jaya’s average whole-building price per tsubo fell from ¥5.7191 million in Q1–Q3 2026 to ¥4.2462 million in Q3 2026, a cumulative 21.93% decline. Azabu-Juban fell from ¥9.4876 million in Q4 2025 to ¥8.1660 million, down 13.93%.
Attention is rising while asking prices are falling—both are happening at once. Set beside Tokyo Kantei’s macro “first decline in 28 months,” this isn’t a one-station quirk but a slice of the 23 wards broadly entering a price-digestion phase.
Risk disclosures Rents, yields, and price-per-tsubo cited here are based on listing (asking) data, not closed prices; there is typically room for negotiation between ask and close. Gross yield is before management fees, repairs, fixed-asset taxes, and vacancy loss. Shinjuku’s sample is only 31, and one outlier distorted the mean in the raw data; we use medians throughout. Station-level averages also mask wide dispersion within the same station area by build year and walk distance; real decisions must drill down to the individual-building level.
4. How different buyers should use this ranking
The takeaway isn’t “Setagaya is better than Minato.” The real point is that these three wards are answering fundamentally different questions; ranking them on the same list invites misinterpretation.
For different buyer types, these names mean different things:
First, for owner-occupier families prioritizing daily-life radius, Setagaya’s logic holds. With a population of roughly 930,000, multi-line connectivity, and comprehensive education and healthcare, it has topped the family segment two years running, and a 4.11% whole-building gross yield suggests prices haven’t yet been bid to imbalance by end-user demand.
Second, for buyers prioritizing asset recognizability and liquidity, Minato’s 3.11% is not a cash-flow purchase but a bet on certainty at exit. The brand equity of the luxury belt, an international tenant pool, and ongoing redevelopment together create assets that are easier to hand off when the market cools—at the cost of accepting roughly a one-third yield discount.
Third, for cash-flow-first investors, Shinjuku’s 4.30% median looks most tempting, but the sample is only 31 and concentrated in mixed-use assets around Kabukicho; the asset character differs materially from the other two and shouldn’t be valued as “pure residential.”
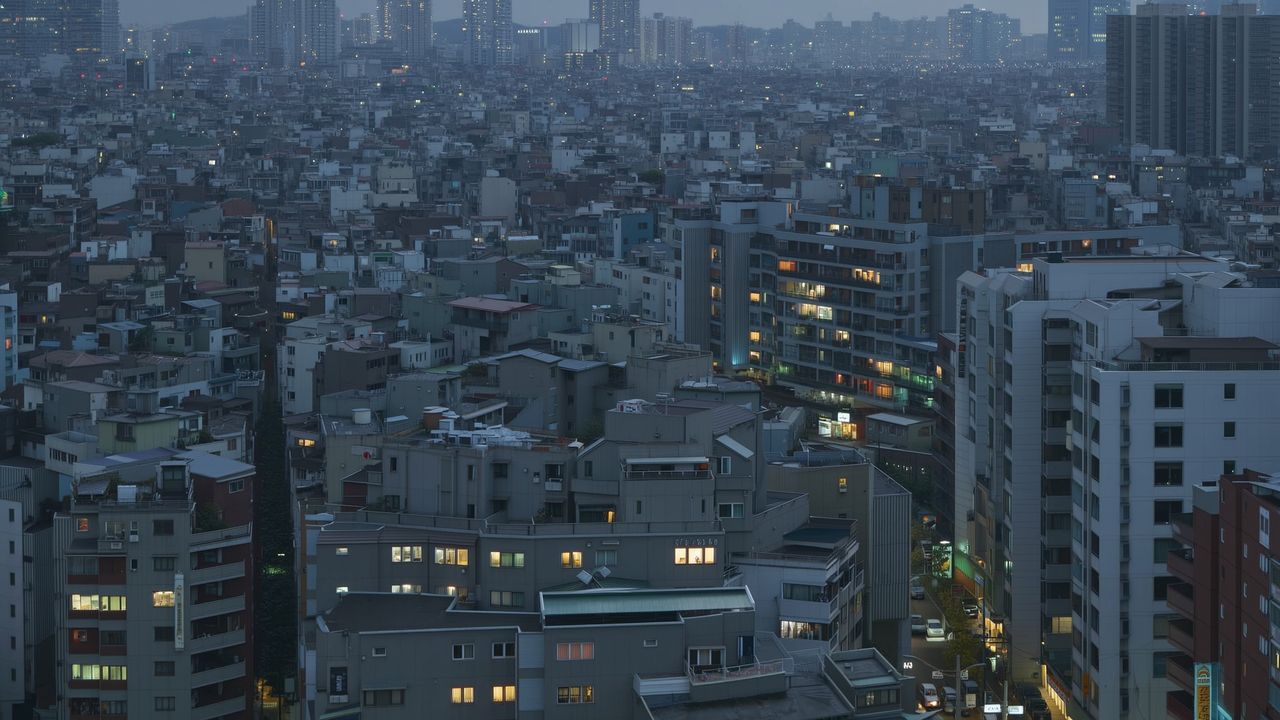
As for what comes next, three straight quarters of price-per-tsubo declines with attention still high usually means buyer and seller price expectations haven’t aligned. After the BOJ lifted the policy rate to 1.25%, financing costs will keep pressure on the denominator in the near term, so these three wards are more likely to keep digesting within the current range than to rebound quickly—an advantageous window for cash-rich, patient buyers.
The right move isn’t to chase the leaderboard, but to pull the ward, line, and price band you care about down to station-level granularity and run your own comparisons. On Urbalytics you can compare rents, gross yields, and price-per-tsubo change percentiles by station and ZIP code.
※ The concept images in this article are AI-generated and not real photographs.
#JapanRealEstate #BuyInTokyo #Tokyo23Wards #Setagaya #Minato #Shinjuku #Sangenjaya #AzabuJuban #GrossYield #RentalYield #WholeBuilding #PreOwnedCondo #TokyoHomePrices #OverseasProperty #Urbalytics
References
- at home Co., Ltd., “Buying & Town Ranking: Tokyo 23 Wards,” 2026, https://www.athome.co.jp/corporate/news/ranking/town/kounyumachi-ranking-23ku-202609/
- Otona Answer, “Latest! at home ‘Buying & Town Ranking’ Tokyo 23 Wards edition: No. 3 ‘Shinjuku’… Who are No. 2 & No. 1?” (via Yahoo! News), 2026, https://news.yahoo.co.jp/articles/c61cac6e78868672868f19ec737abd788f2ca7a7
- Asahi Shimbun, “Tokyo’s pre-owned condo prices ‘fall for the first time in 28 months’: adjustment phase in the city center” (Tokyo Kantei August 2026 data), 2026, https://www.asahi.com/
- Kyodo News, “Tokyo’s 23 wards fall for 3 straight months: August pre-owned condos,” 2026, https://news.yahoo.co.jp/
- Kenbiya, “Liquidity decline becomes clear in pre-owned condos across Tokyo’s 23 wards,” 2026, https://www.kenbiya.com/ar/ns/research/price_trends/10533.html
- Urbalytics platform data (rent_stats / building_cap_rate_stats, retrieved September 24, 2026), 2026, https://www.urbalytics.jp/
Copyright: This article is original content by the author. Please do not reproduce, copy, or quote without permission. For usage requests, please contact the author or this site.