Words: 1639 | Estimated Reading Time: 9 minutes | Views: 43
When the repayment term stretches to 50 years, the homebuying ledger in Tokyo is no longer won by interest rates, but by the rent assumptions you make.
On the evening of September 14, Japanese TV news showed two scenes side by side: on one side, the Bank of Japan’s Monetary Policy Meeting set for three days later, with markets widely expecting a policy-rate hike to be back on the table; on the other, a woman in her 40s in a street interview saying that if the monthly payment could be a bit lower, 50 years would be acceptable.
Viewed together, these images say more about Tokyo’s housing market than any standalone rate headline. Rates are rising, prices haven’t fallen, so the market invented an outlet—lengthen time.
Before September 17, get the interest line item right
Japanese home loans come in two rate structures—fixed and floating—and this time it’s the latter that’s directly pulled by policy. Citing estimates by MOGE CHECK board member Takashi Shiozawa, TBS calculated that for a 50 million yen loan over 35 years, at a fixed 3.5% the monthly payment is 206,645 yen, with total interest of 36.79 million yen.
The same principal at a floating 1.2% cuts the monthly to 145,851 yen, with total interest of 11.26 million yen—a difference of over 25 million yen, nearly the price of a small unit on Tokyo’s outskirts.
But the price of floating is uncertainty. Shiozawa’s more realistic case: if the floating rate rises from 1.2% to 1.5%, total interest climbs from 11.26 million to 14.30 million—30 basis points eat 3 million yen. Some banks could adjust as early as October.
Fixed-rate pricing is shifting too. Kenbiya’s back-to-back analyses on September 12 and 13 note that on September 1, 2026, the yield on newly issued 10-year JGBs topped 3.0% for the first time in about 30 years. Fixed rates are anchored to such medium/long-term market rates, then layered with banks’ funding costs, borrower and collateral risk, and bank margins.
In short, the foundational layer common to all borrowers has been raised.
Prices didn’t fall, so maturities got longer
What turned “50-year mortgages” from a punchline into a product is stubborn pricing. According to the Real Estate Economic Institute, in H1 2026 the median price of newly built condominiums in Tokyo’s 23 wards was about 120 million yen, while the July monthly average was yanked up to 260 million yen by a handful of ultra-luxury projects.
At those prices, a 35-year standard-term monthly payment is already out of reach for ordinary salaried households.
The market’s response: extend terms. A January 2026 survey by the Japan Housing Finance Agency shows the share of loans with repayment periods over 40 years rose from 1.7% in October 2023 to 5.5%, more than tripling in just over three years.
Shiozawa lays out the pros and cons plainly. Pros: lower monthly payments and a reduced debt-service ratio against income, which in turn lifts borrowing capacity; the freed-up cash flow can be invested.
The cons are twofold, and both are long-term:
First, total interest balloons—the extra 15 years on the same principal are all compounding interest, which ultimately appears as “total outlay” on your balance sheet three decades from now.
Second, and riskier, is negative equity (残債割れ): because principal amortizes very slowly at the start, if you need to sell mid-way, sale proceeds may be insufficient to clear the remaining loan, turning the home from an asset into a liability you must top up to exit.
Anchor Takahiro Inoue’s comment was the most clear-eyed: more choice is good, but the fact that “home prices have risen so far beyond what normal terms can reach that we need to invent 50-year loans” is itself abnormal.
The Mitaka math hinges on one assumption
TBS ran a concrete 50-year model: Mitaka, Tokyo; 2LDK; 10 years old; 10-minute walk.
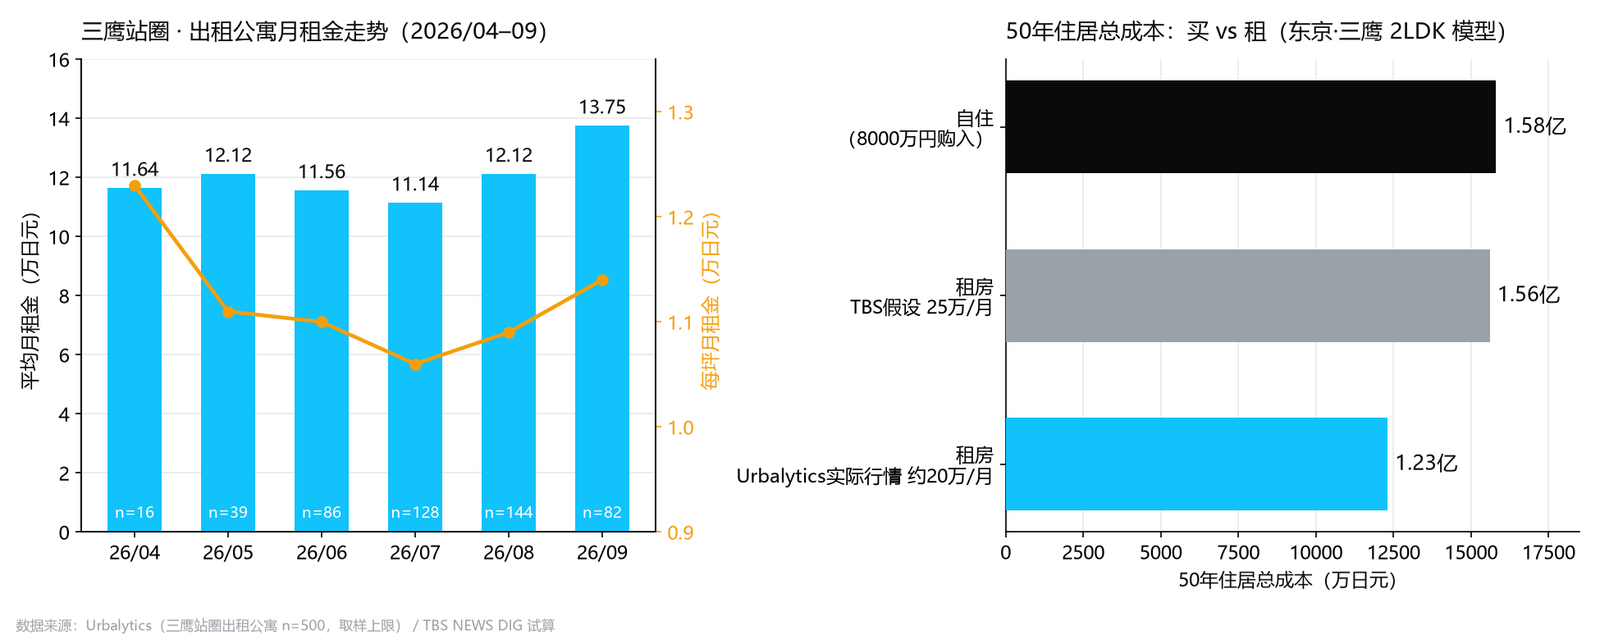
Owner-occupier side: 80 million yen purchase price; 2% mortgage rate; 250,000 yen annual fixed-asset tax; 5 million yen renovation budget. Cumulative 50-year cost about 158 million yen. Rental side: 250,000 yen monthly rent plus a one-month renewal fee every two years; 50-year cumulative about 156 million yen.
The two figures are almost a tie, hence the “both make sense” conclusion. But that tie rests entirely on one assumption: “250,000 yen monthly rent.”
We cross-checked with Urbalytics’ rent statistics. In the Mitaka Station area, the median asking rent per square meter for rental apartments is about 3,280 yen. On a 60 sqm 2LDK, the actual market sits around 200,000 yen per month, not the model’s 250,000.
That 50,000-yen monthly gap becomes a structural difference across a 50-year timeline.
Urbalytics Insight Recomputing with Urbalytics’ actual per-sqm rent for the Mitaka Station area, the 50-year total rental cost is about 123 million yen, roughly 33 million yen below the TBS model and about 35 million below the owner-occupier plan. In other words, the widely cited “buy ≈ rent” conclusion is far more sensitive to which rent number you plug in than it is to rates or prices.
This does not mean renting is always the better deal. The 50-year owner-occupier cost leaves you with an asset, whereas 120 million yen of rent is a pure expense. But it does show that any “buy vs. rent” verdict must first surface the rent assumption; otherwise, the conclusion is only an echo of the premise.
The rent side is moving too
Shifting from mortgages to rents reveals another overlooked variable: it’s not only home prices that are rising.
Urbalytics’ monthly series shows average monthly rent in the Mitaka Station area drifting up from 116,400 yen in April 2026 to 137,500 yen in September. Note that the per-tsubo unit price slipped from 12,300 to 11,400 yen over the same period—headline rent rose mainly because listed unit sizes increased, not because unit prices broadly rose; with only 82 samples in September, treat this as indicative.
That detail matters: it means Mitaka’s current rent pressure reads more as “the homes you can rent have become more expensive” than “the same unit got marked up.” For budget-sensitive tenants, feasible unit sizes are being pushed upward.
As rents rise, another risk line is tightening. TBS noted that renters start encountering landlord caution around age 65, while on the mortgage side, screening becomes notably stricter by 50 at the latest.
Risk note Each path—buy or rent—has an institutional closing age: roughly 50 on the lending side, roughly 65 on the leasing side. For cross-border buyers only beginning to consider settling in Tokyo after 40, “wait two more years” is itself a decision with a cost.
The market is also testing exits. In Fujisawa, Kanagawa, the rental apartment “Nobishiro House Kameino” halves the usual 70,000-yen rent to 35,000 yen for tenants willing to take on a “caretaker” role for elderly solo dwellers—conditions include a monthly tea gathering, greetings at least twice a week, and confirming via LINE if contact is missed. As of the 14th, five of the seven households were elderly living alone, with the remaining two in their 20s.
Such designs remain rare overall, but they point to a direction: in a market where aging and rent inflation advance together, leases are being rewritten as contracts that bundle obligations, not just price-for-space exchanges.
Three takeaways for cross-border buyers
For buyers viewing this market from China, the most useful takeaway from this Japanese cycle is not “will Tokyo prices keep rising,” but three judgments you can plug directly into decisions.
First, choosing a rate structure is no longer a directional bet. The most valuable line in those two Kenbiya pieces: the essence of a fixed rate is not “guess future rates,” but “lock in future payment burden.” With the 10-year JGB at 3%, the fixed–floating spread is no longer free insurance—you need to be explicit about what you’re paying for.
Second, 50-year mortgages are hardly practical for non-residents. Japanese lenders already apply stricter age, residency, and income documentation standards to foreign and non-resident borrowers, and ultra-long terms further amplify concerns about the “age at full repayment” (完済年齢)—read this as a market signal, not a usable tool.
Finally, and most actionable: in your own model, use achieved rent per square meter, not a broker’s “around here it’s about…”. In the Mitaka case, a 50,000-yen monthly rent assumption gap becomes a 33 million yen outcome gap over 50 years.
To turn assumptions into verifiable inputs, Urbalytics’ rent statistics and whole-building gross yield distributions can be pulled by station area—Mitaka Station’s current median advertised gross yield for whole-building income assets is about 5.26%, a much sturdier starting point than “I heard.”
#TokyoHomebuying #JapanMortgages #50YearMortgage #HousingLoans #BOJRateHike #LongTermRates #Mitaka #BuyVsRent #TokyoRents #JapanRealEstateInvestment #NegativeEquity #CrossBorderBuying #Urbalytics #JapanPropertyData
Note: Images in this article are AI-generated concept visuals, not real photos; charts are produced from Urbalytics data.
References
- TBS NEWS DIG (N Sta analysis), 2026, “Mortgage rates may rise again… Which is the better deal, owning or renting? As rates are lifted, ‘ultra-long’ home loans increase”, https://news.yahoo.co.jp/articles/b72bbec2a646269ac0c1a4dfa9d6d26818db9fab
- TBS NEWS DIG (N Sta analysis), 2026, “Are you in the owning camp or the renting camp? Rents are trending up… Some properties halve rent under ‘certain conditions’”, https://news.yahoo.co.jp/articles/a9d1ba2a24b873e207378440f8e5c7ca4a892b9d
- Kenbiya, 2026, “The shock of 3% long-term rates! How fixed mortgage rates are set [Part 1]”, https://www.kenbiya.com/ar/ns/loan/interest_rate/10510.html
- Kenbiya, 2026, “The shock of 3% long-term rates! How fixed mortgage rates are set [Part 2]”, https://www.kenbiya.com/ar/ns/loan/interest_rate/10511.html
- Japan Housing Finance Agency, 2026, “Survey on Mortgage Users” (January 2026; via TBS reporting), https://www.jhf.go.jp/
- Real Estate Economic Institute, 2026, Greater Tokyo Newly Built Condominium Market Trends (via TBS reporting), https://www.fudousankeizai.co.jp/
- Urbalytics, 2026, Mitaka Station Area Rent Statistics & Whole-Building Yield Statistics (platform internal data), https://www.urbalytics.jp/
Copyright: This article is original content by the author. Please do not reproduce, copy, or quote without permission. For usage requests, please contact the author or this site.