Words: 2088 | Estimated Reading Time: 11 minutes | Views: 78
Yasaka (八坂) took the top spot in Greater Tokyo with 147 units, edging out Kaihin-Makuhari (海浜幕張). This signals a shift in the market’s pricing anchor from “minutes to the city center” to “whether daily life is self-contained within the local living area.”
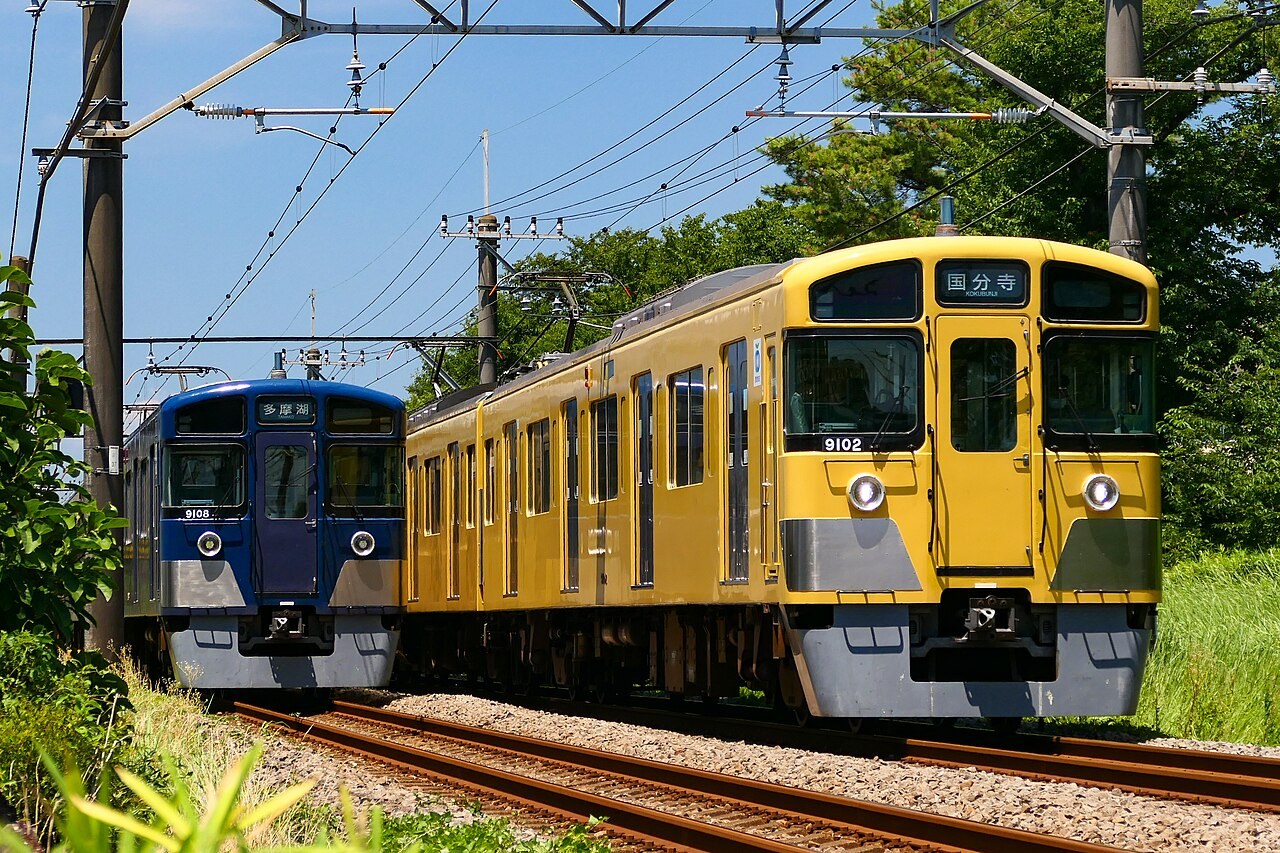
A ranking that makes you pause
Line up the number of new-condominium units supplied by station across Greater Tokyo in May 2026, and the leader is neither Toyosu nor Musashi-Kosugi, nor any of the names that recur in brokerage ads.
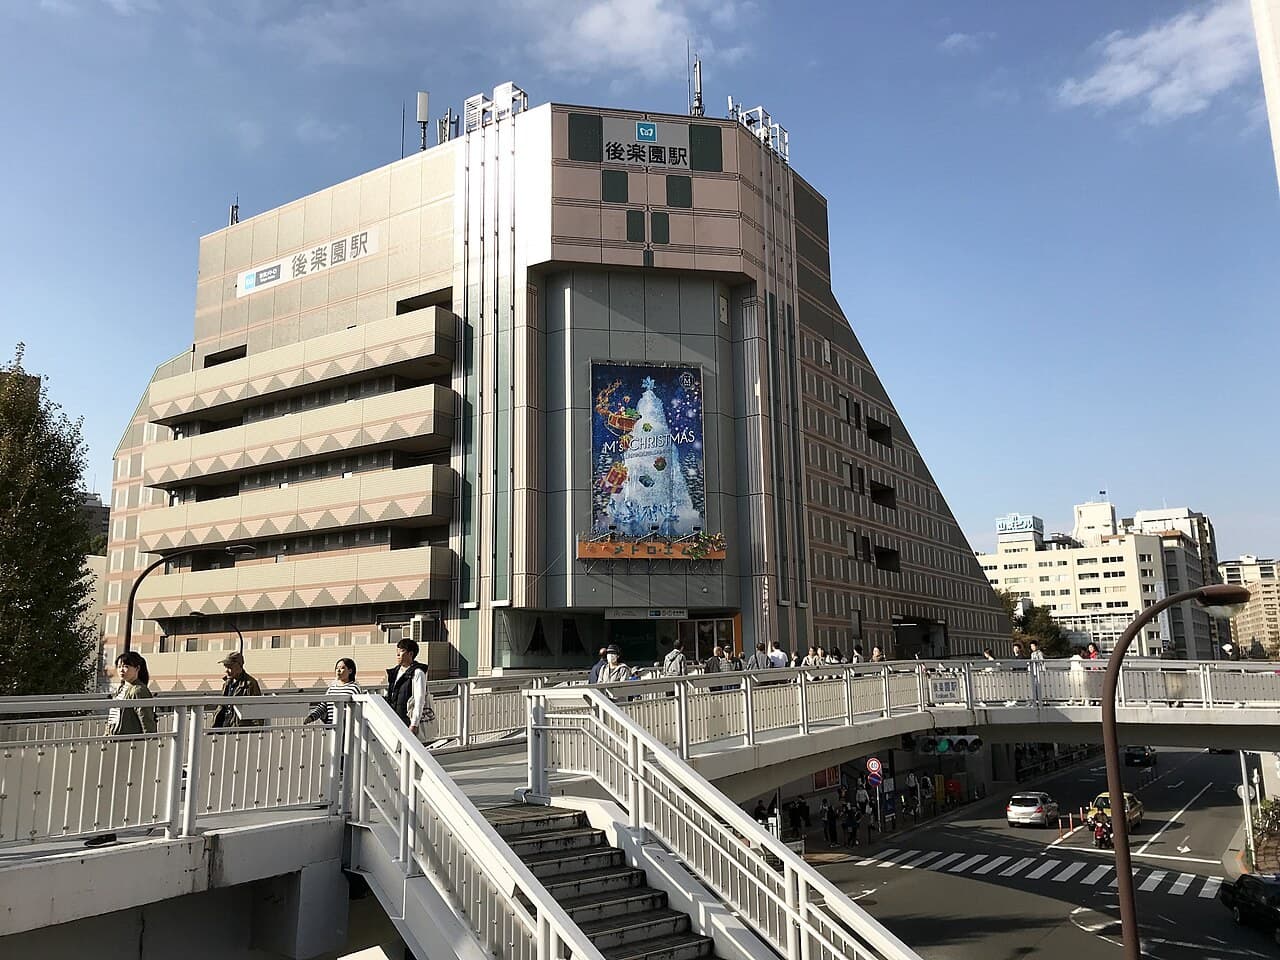
According to monthly statistics from real estate data firm Mercury, No. 1 is Seibu Tamako Line, Yasaka Station (八坂) with 147 units (Higashi-Murayama (東村山), Tokyo). No. 2 is JR Keiyo Line, Kaihin-Makuhari (海浜幕張) with 118 units; No. 3 is Hachioji (八王子) with 117; No. 4 is Odawara (小田原) with 108.
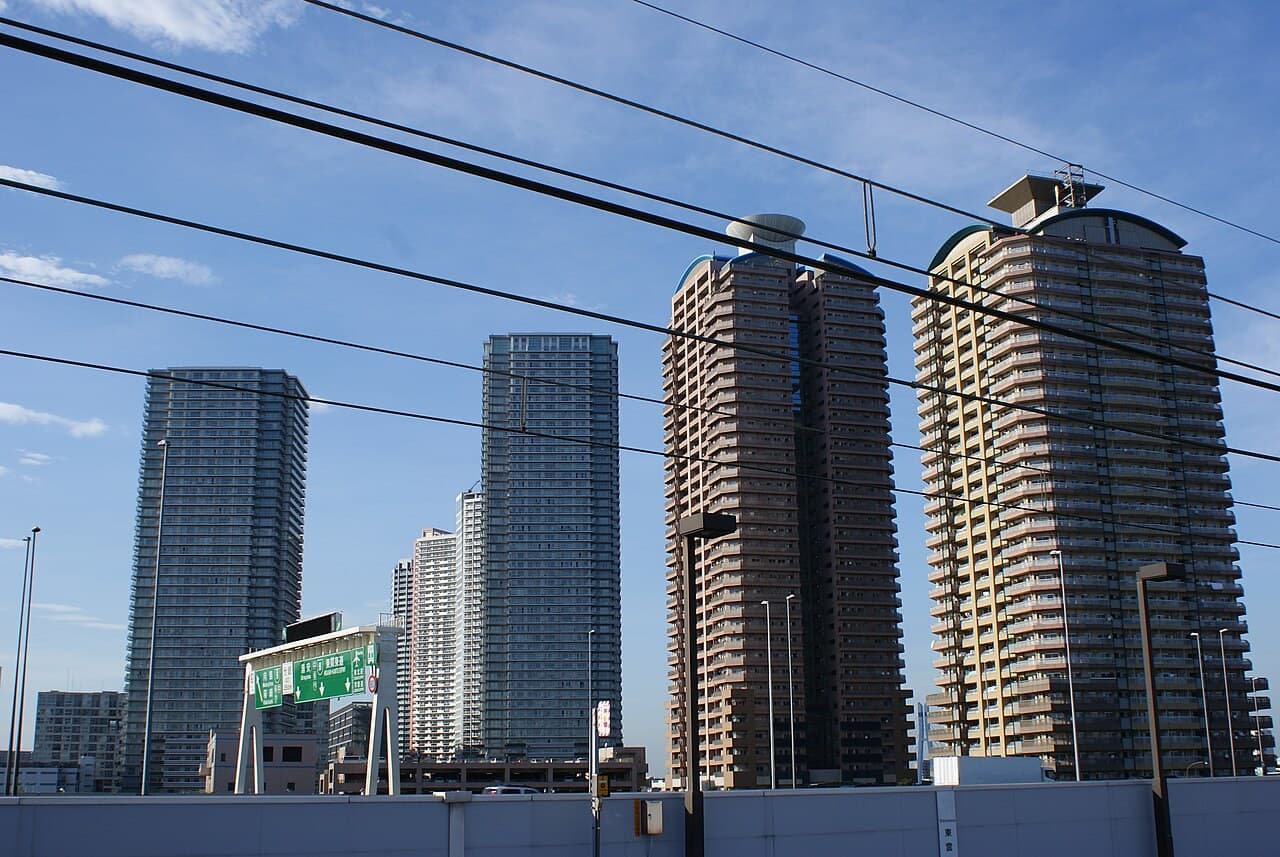
The lineup itself is a statement. Yasaka is a small branch-line stop that even many Tokyo residents would have to look up on a map. Yet it surpassed Kaihin-Makuhari, known for the Makuhari Bay Park high-rise cluster — a textbook example of Japan’s transit-oriented development (TOD).
None of the traditional “hot areas” appear among the top four stations. Mid-tier stations dominating the supply rankings is not statistical noise; it is where developers “voted” with their land acquisitions — i.e., they have been allocating capital to these nodes for several years.
Where did the core’s push-out effect send demand?
To understand why as many as 147 units were concentrated in Yasaka, we need to gauge the strength of the force pushing demand outward.
In May 2026, the average new-condominium price in the 23 wards reached ¥133.49 million. The once-surprising term “okushon” (condos priced in the hundred-millions of yen) is now effectively median in the 23 wards, and the price-to-income multiple has detached from real-economy coordinates.
Purchasing power pushed out of the core has re-landed around key suburban stations, leaving strong price traces. In Tokyo’s municipalities outside the 23 wards, the average price rose to ¥88.18 million, up 33.9% year on year. Chiba Prefecture jumped to ¥75.20 million, up 51.5% year on year, with a first-month absorption rate of 73%.
In Kanagawa Prefecture (excluding Yokohama and Kawasaki), units supplied more than doubled year on year, and the average price reached ¥80.74 million. Across Greater Tokyo as a whole, new supply fell 13.3% year on year, yet the first-month absorption rate rose to 67%, up 19.0 points — supply is tightening while absorption speed is accelerating.
However, one misreading needs correcting. If you summarize this as “everyone is moving to the suburbs,” you will miss the sharpest divide this year.
In the same month, Saitama Prefecture’s units supplied fell 70.2% year on year, with a first-month absorption rate of just 47%. Yokohama and Kawasaki posted 57%, clearly lagging Chiba. Cheapness per se is no longer a selling point; areas lacking a clear lifestyle proposition are being ruthlessly filtered out by buyers.
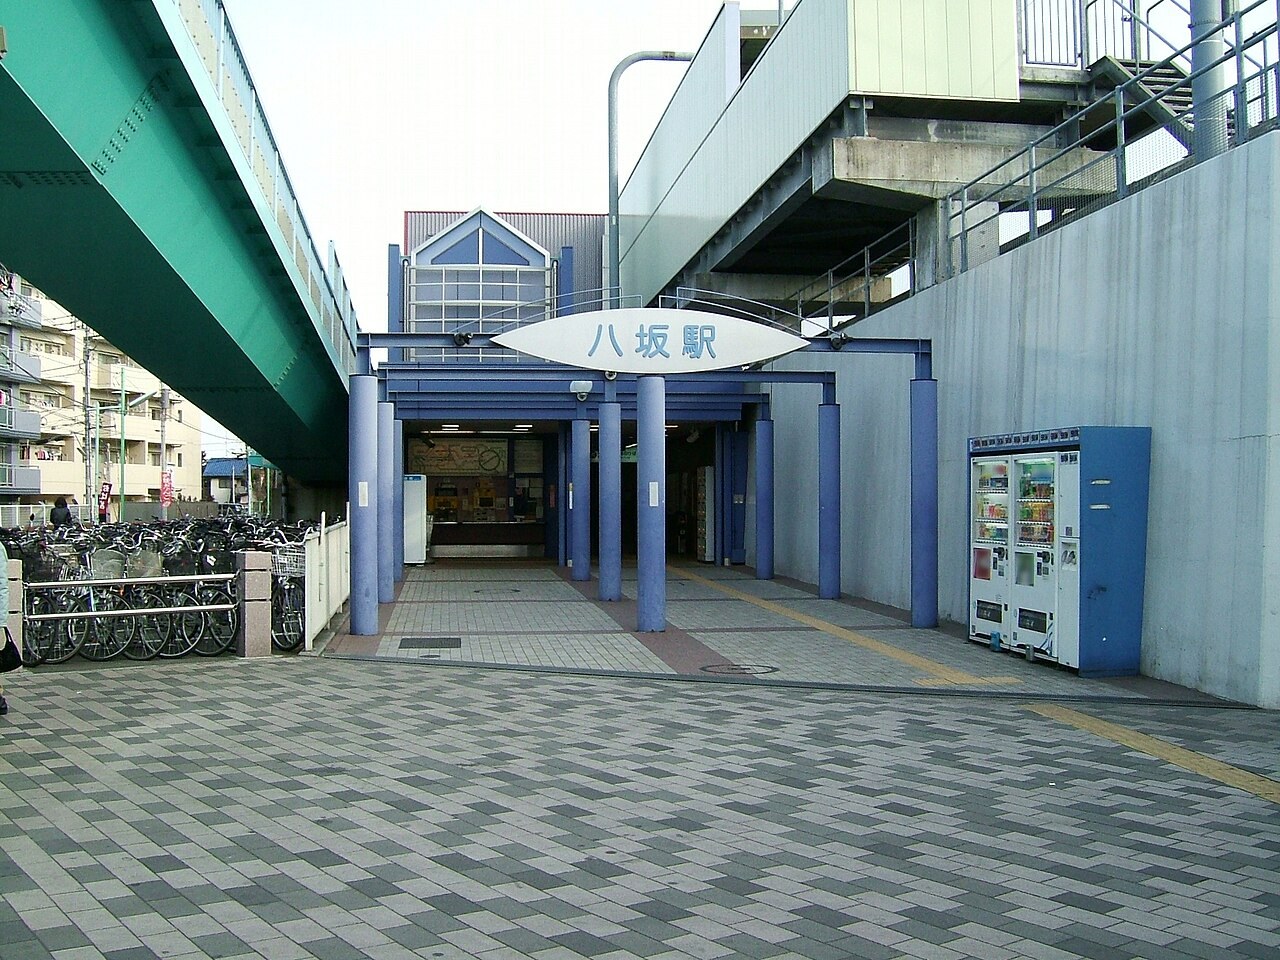
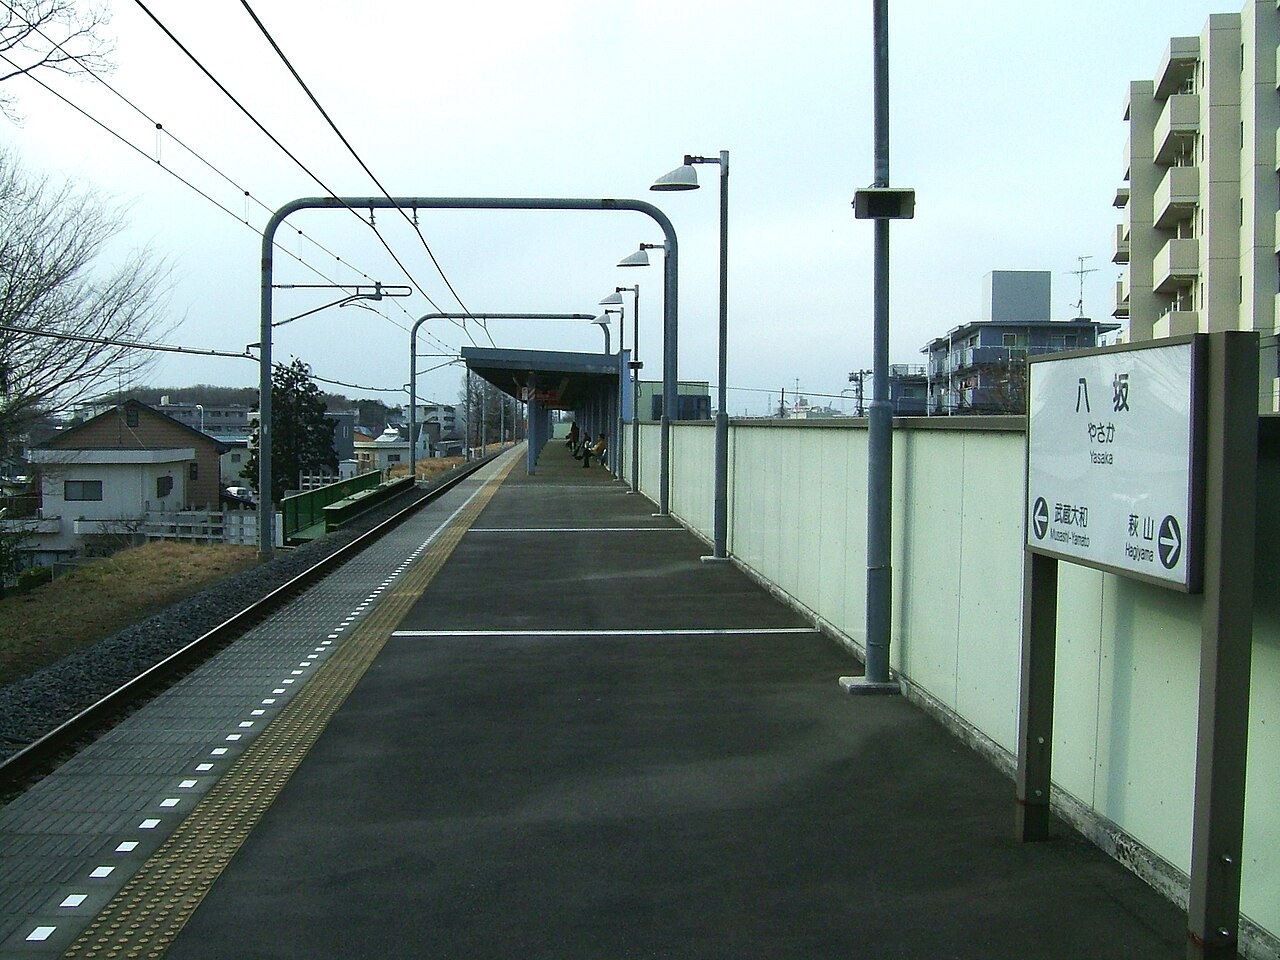
Why Yasaka is Yasaka: the compounding created by a 700-meter shopping street
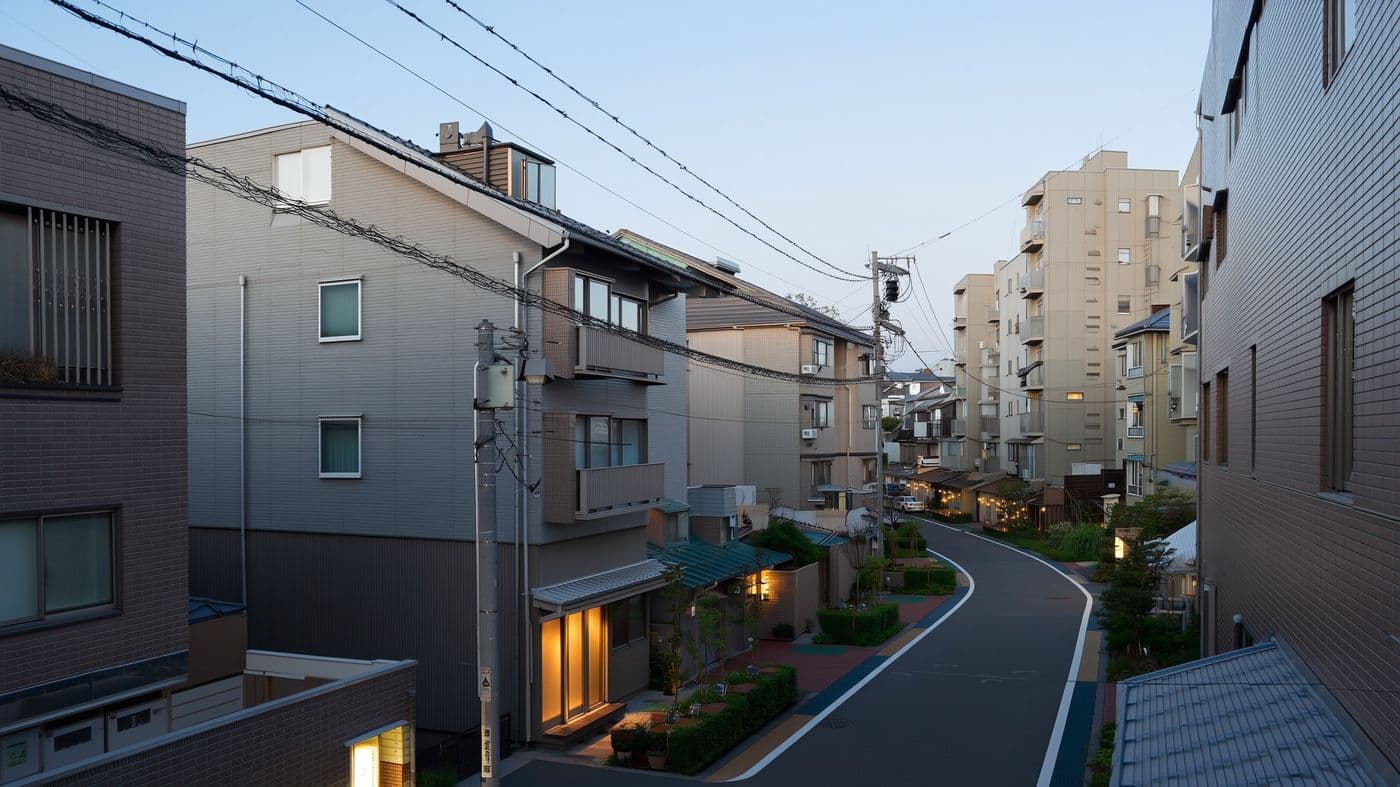
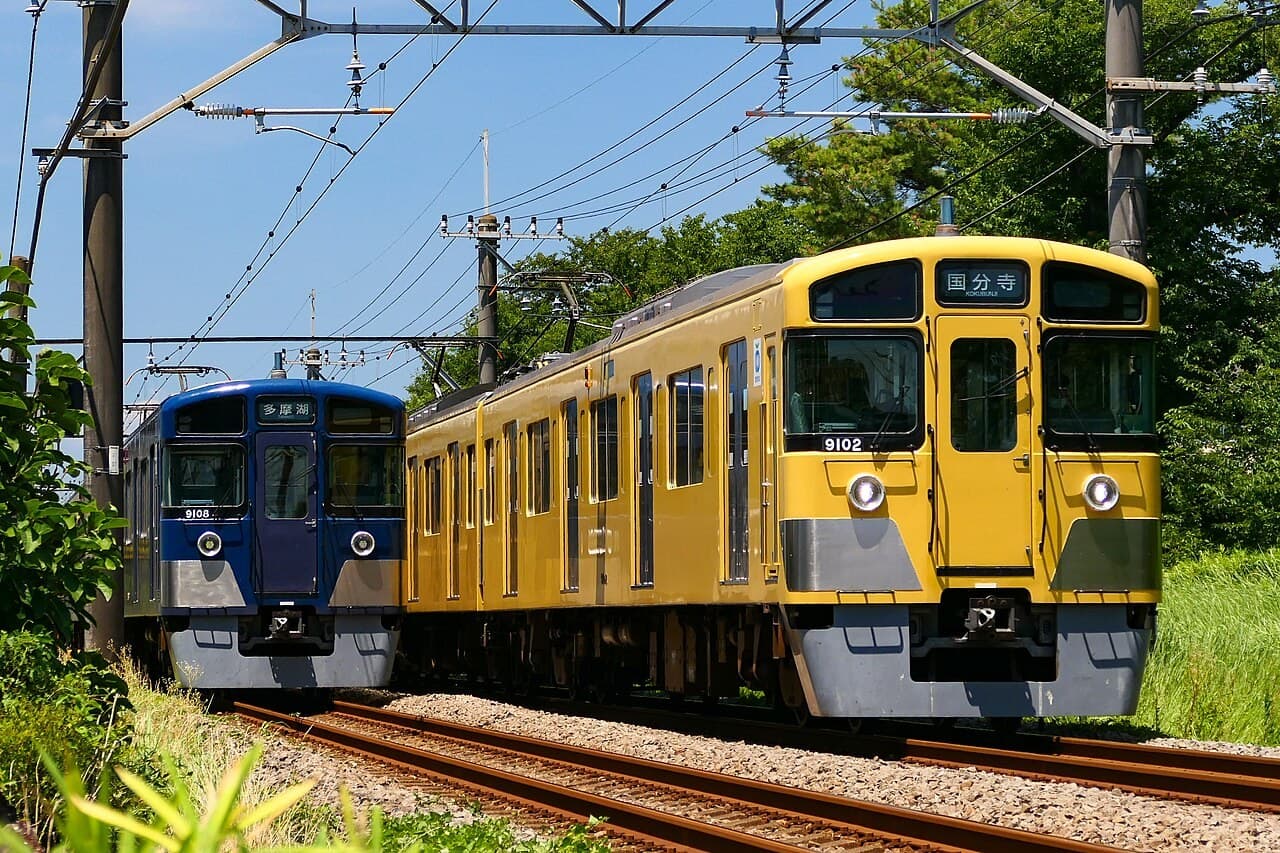
Higashi-Murayama City (東村山) is an underrated rail city. Within the city limits, 8 lines and 9 stations crisscross in a mesh, with several branch lines — including the Kokubunji Line and Haijima Line — intersecting within a small radius.
Yasaka’s true distinctiveness lies in the roughly 700 meters of shopping street that runs to Seibu Shinjuku Line’s Kumegawa (久米川). The two stations are stitched together by a continuous commercial corridor, forming a composite living area where daily needs can be completed on foot without relying on a car.
This is rare equipment in Japan’s suburbs. Many suburban tracts developed in the same era followed a different path — disorderly urban sprawl, roadside retail concentration, and near-total dependence on the family car. The bill for that model — ballooning road maintenance costs and large numbers of elderly “mobility disadvantaged” — is now coming due.
Civic groups and the local shopping street in Higashi-Murayama preserved pedestrian-first street scale. Decades later, that insistence became the most efficient magnet for families with children. Developers concentrating 147 units in Yasaka is, in essence, pricing the compounding created by this shopping street.
Urbalytics internal data: unit rents are the same, but floor areas are larger
No matter how compelling an area narrative is, it must resolve to auditable numbers. Aggregating rental apartment samples in the Yasaka, Kumegawa, and Higashi-Murayama station areas on the Urbalytics platform to compute unit rents reveals a structure that is often overlooked.
Yasaka’s station area has 35 samples, an average monthly rent of ¥108,100, and an average private area of 43.87 m², equating to about ¥2,397 per m². Kumegawa’s area has a thicker sample of 120, with an average monthly rent of ¥68,300, an average area of 30.95 m², and a unit rent of about ¥2,401 per m².
The two stations’ unit rents overlap almost perfectly, with a difference of under 0.2%. This corroborates the shopping-street effect from the rental side as well: the market is not discounting Yasaka for being a small branch-line stop; it is pricing it as the same living area as Kumegawa.
The essential difference lies in layout (floor area). At the same unit price level, Yasaka’s average area is about 13 m² larger than Kumegawa’s — precisely the extra space most needed by families pushed out of the core. In the Higashi-Murayama station area (100 samples), unit rent is about ¥2,340 per m², forming a tight band with the first two.
The income side for single-building assets (entire buildings/apartment blocks) also provides coordinates. In the Kumegawa area, 54 active-for-sale samples show an average gross yield of 7.67%, a median of 7.43%, and an average asking price of about ¥115 million. Higashi-Murayama has 34 samples with an average of 7.34%, a median of 7.15%, and an average price of about ¥193 million.
For horizontal comparison, Hachioji’s station area has 173 samples, averaging 7.87% with a 7.81% median. Across the Tama area, gross yields on single-building assets are stable in the 7% range — a completely different market from core station areas stuck around the 3% line.
Urbalytics Insight Urbalytics’ internal data are real-time, listing-by-listing aggregations of active-for-sale/active-for-lease records (not media-sourced area averages). The conclusion that Yasaka and Kumegawa’s unit rents differ by less than 0.2% is invisible in area-average tables and only becomes verifiable at the sample level. The same disclosure applies to sample depth: in the Kaihin-Makuhari (海浜幕張) station area there is only one active-for-sale single-building sample (gross yield 6.52%), which should be treated as a reference value only.
From “minutes to the city center” to “is the living area self-contained”
Taken together, the numbers depict not nostalgia for a suburban return, but a broad shift in evaluation axes.
For years, housing pricing in Japan relied on radial commuter networks — the value of a home equaled its ability to move labor efficiently to giant office districts. Hence “minutes to the city center” was the only number that mattered in ads. The normalization of remote work has stripped away half of that premise.
Once the constraint of riding crush-hour trains daily loosens, buyers begin reallocating budget and time away from “central access” toward local comfort and spatial slack — the fact that this year’s top-supply projects generally average over 70 m² of private area is a direct result.
The spread of micromobility — share cycles and e-scooters — has further diluted the industry dictum of “X minutes on foot to the station.” Even if a project sits a little farther from the station, area circulation remains intact and location-driven mobility gaps are narrowing.
Today’s buyers do not want districts that are unlivable without a car, nor districts where cars are entirely unnecessary. They want environments where rail, bus, walking, cycling, car-share, and even a private car can be combined seamlessly by use case — new builds that offer onsite car-share and parking/docking for micromobility as standard amenities have become commonplace.
Municipal policy is fully aligned with this direction. To sustain infrastructure under population decline, cities are accelerating the “Compact Plus Network” approach — concentrating urban functions around stations and linking them by public transport. Toyama City cut road capacity alongside introducing new light rail (LRT), meaningfully lowering car dependence. Utsunomiya City’s all-new LRT is another implementation of the same idea.
Data overview: rents, yields, and price per tsubo (3.3 m²)
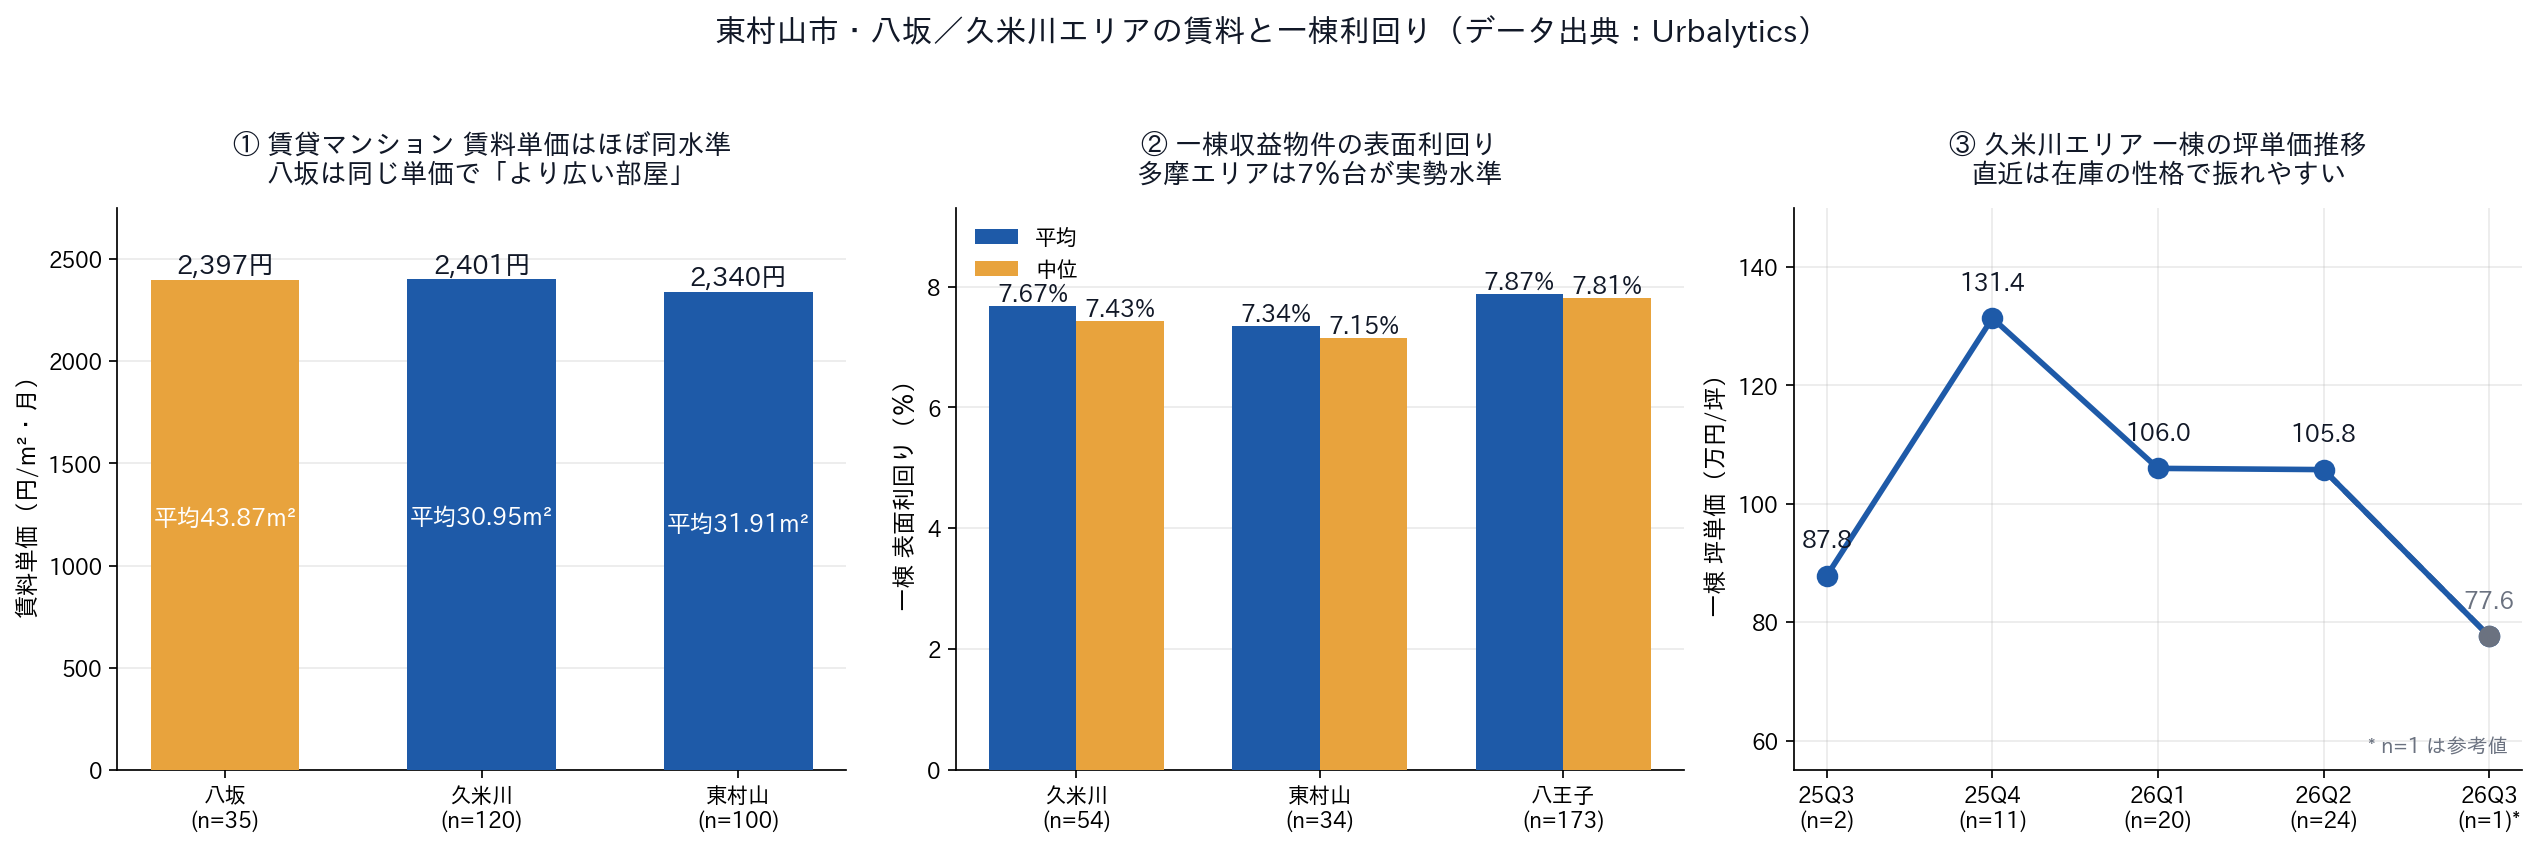
The left panel shows unit rents and average areas for rental apartments across the three station areas; the center panel shows the distribution of gross yields for active-for-sale single-building samples; the right panel shows the quarterly trend in price per tsubo for single-building assets in the Kumegawa station area.
The price-per-tsubo line requires careful reading. It jumps from ¥878,500 per tsubo in Q3 2025 to ¥1,313,800 in Q4, then to ¥1,059,900 in Q1 2026 and ¥1,057,800 in Q2 — the main driver of this amplitude is differences in listing characteristics in each quarter’s active inventory, not a sudden swing in underlying area value.
The Q3 2026 figure of ¥776,400 per tsubo is based on a single sample and is rendered with a dashed line and a star marker in the chart. This is a reference value, not a confirmation of trend. In areas like Tama with limited trading depth, inferring inflection points from a single quarter’s average is highly precarious.
Risk disclosure Concentration of supply is a risk in itself: When 147 units hit a small branch-line station around the same time, resale listings will cluster several years later, making it easier for same-cohort competitors to pressure each other on price at exit. Single-building samples in the Tama area are generally older, and a 7% gross yield embeds allowances for aging and redevelopment costs. Net yields, after management fees, repair reserves, and vacancy loss, are lower. More fundamentally, Yasaka’s premium depends heavily on the sustained commercial vitality of that shopping street. If local commerce weakens, the selling point of “a walkable, self-contained life” could fade faster than a redevelopment concept.
Implications for investors
Supply rankings are an underappreciated leading indicator. What they record is not the market that has already happened but the decisions developers made years ago when buying land, and they point to structural direction earlier than transaction price indices.
There is also a background data point to watch: new housing starts are plunging. Much of the bustle around today’s large projects is simply inventory started years ago reaching completion in sequence. A sharp compression of new supply in Greater Tokyo a few years from now is a near certainty.
As new-build scarcity rises and prices remain stuck at elevated levels, surface parameters such as name recognition or “distance to the core” will not be determinative. What will truly be priced is how mobility and services run over the district’s physical fabric, and how smoothly daily flows are integrated.
For long-term overseas investors, areas like Tama offer an asset profile very different from the core.
First, returns tilt more to income than capital gains. Gross yields in the 7% range mean cash flow can cover holding costs, raising tolerance for FX swings and remote ownership versus core assets stuck near 3%.
Second, selection needs to be one notch more granular. Even under the same “Tama” label, market response can differ by 2x between Yasaka and parts of Saitama. The basis for judgment should be sample-level unit rents, yield distributions, and actual absorption speed — not prefectural or city averages.
This is precisely the problem Urbalytics is built to solve: decomposing an area’s narrative into rents, yields, and closed-deal samples at auditable granularity so the question “Does this station merit investment?” can be answered with data, not intuition.
Tags
#Higashi-Murayama #YasakaStation #KumegawaStation #TamaArea #GreaterTokyoCondos #NewCondoSupply #SingleBuildingInvestment #GrossYield #RentLevels #TokyoSuburbs #SelfContainedLiving #JapanRealEstateInvestment #KaihinMakuhari #Hachioji #Urbalytics
References
- Yahoo! News (Merkmal), 2026, Beating Kaihin-Makuhari to rank No. 1 in Greater Tokyo — what the “Seibu Tamako Line station” revealed by new-condo supply counts, https://news.yahoo.co.jp/articles/d9fd261a0810b08c9256fbee7235af04c4a51b3b
- Mercury, 2026, Monthly New Condominium Trends, August 2026 (Sales Results for May 2026), https://www.mercury-inc.co.jp/
- Higashi-Murayama City, 2026, Public transport and urban planning materials, https://www.city.higashimurayama.tokyo.jp/
- Ministry of Land, Infrastructure, Transport and Tourism, 2026, Promotion of the “Compact Plus Network”, https://www.mlit.go.jp/toshi/city_plan/toshi_city_plan_tk_000016.html
- Toyama City, 2026, Public transport/LRT network, https://www.city.toyama.lg.jp/
- Utsunomiya City, 2026, Haga–Utsunomiya LRT (Light Line), https://www.city.utsunomiya.tochigi.jp/
- Urbalytics, 2026, Rent statistics and single-building yield statistics (Yasaka/Kumegawa/Higashi-Murayama/Hachioji/Kaihin-Makuhari station areas), https://www.urbalytics.jp/
Copyright: This article is original content by the author. Please do not reproduce, copy, or quote without permission. For usage requests, please contact the author or this site.