Words: 1234 | Estimated Reading Time: 7 minutes | Views: 138
Japan Mortgage Rates Hit Record High: Flat35 Breaks 3.46%, Tokyo Investment Spread Narrows to Critical
Three Unusual Signals in September's Mortgage Data
The September 2026 mortgage market released three unusual signals. First, on September 1, the 10-year Japanese government bond yield briefly touched 3.000%—the first time in roughly 30 years. Second, Flat35 (loan term 21-35 years, LTV at or below 90%, new JHF group credit insurance) recorded its most frequent September rate at 3.460% per annum, up 0.170 percentage points from August's 3.290%—a second consecutive monthly rise and the highest level since the methodology change in October 2017. Third, MUFG Bank and Sumitomo Mitsui Banking Corporation raised their preferred variable mortgage rates to 1.195% and 1.525% respectively, both up 0.25 percentage points, while Mizuho, Resona, and Sumitomo Mitsui Trust held their rates steady in the 0.950%-1.080% range.
The simultaneous appearance of these three numbers means it is now absorbing two pressures at once: "rising long-term rates on the fixed side" and "policy rate normalization transmitting to the retail side on the variable side." The drivers behind each are different. Long-term rates track the 10-year JGB yield, pricing future inflation and fiscal conditions. Variable rates follow the short-term prime rate, reflecting the pace of monetary policy normalization feeding into retail pricing. The September 18 BoJ rate hike from 1.0% to 1.25% belongs to the second category, while the September 1 long-term bond yield at 3.000% belongs to the first.
What Monthly Payments Actually Look Like
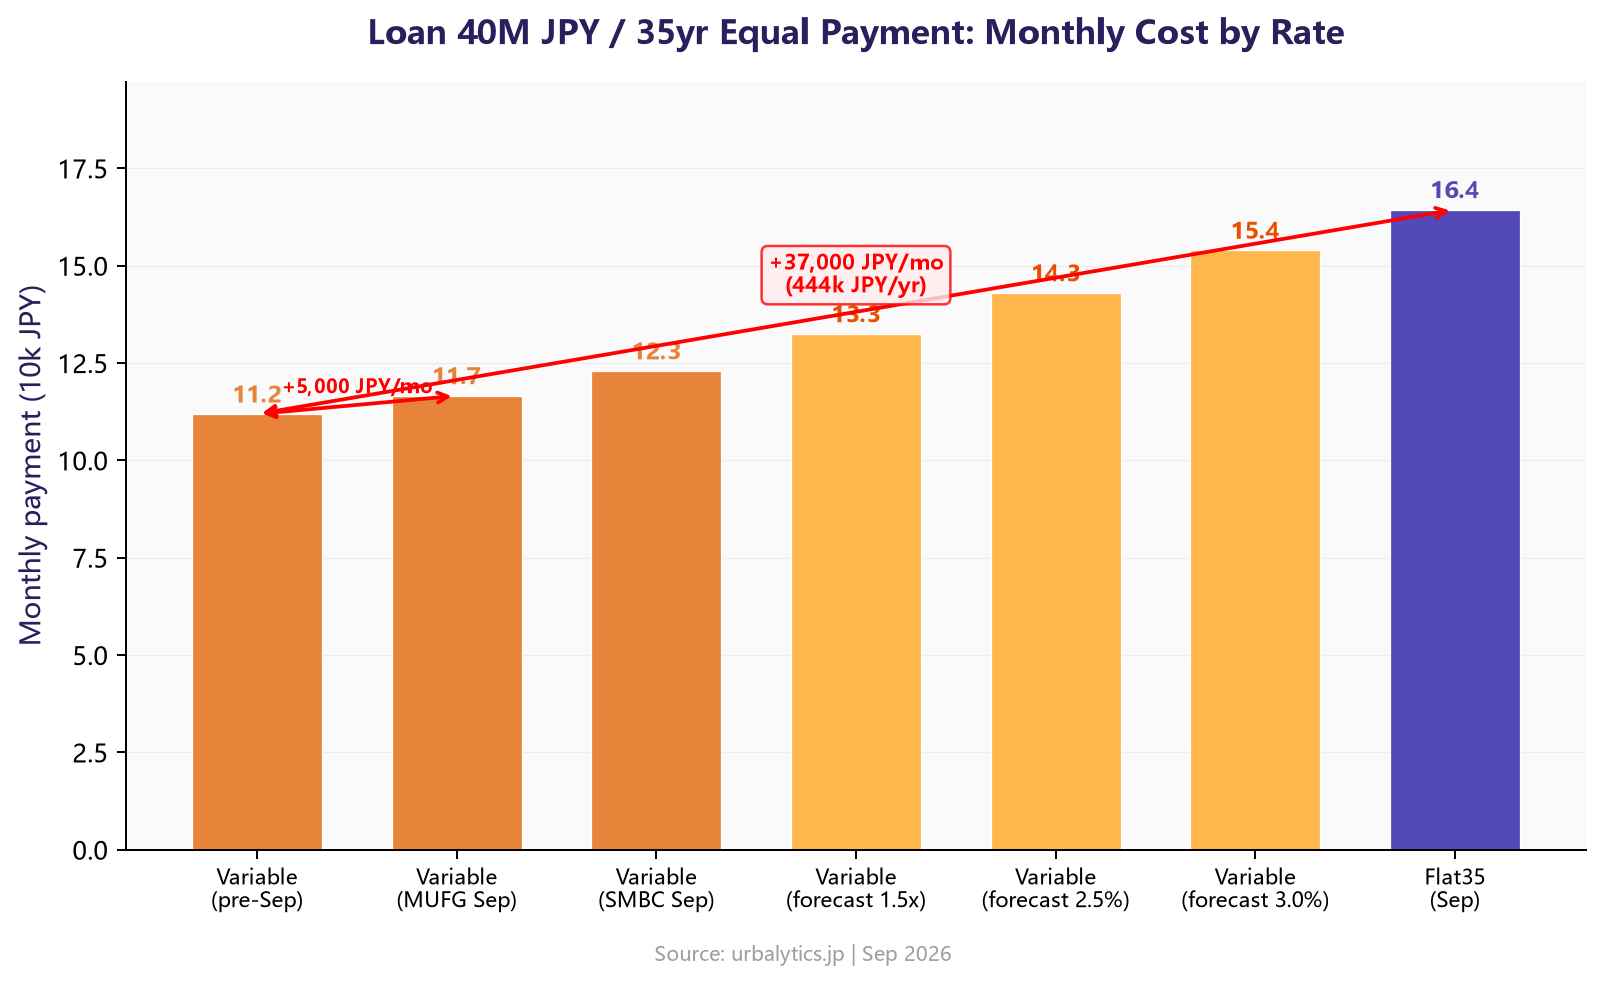
To put the choice's impact on household leverage in concrete numbers: on a 40 million yen loan, 35-year equal-payment-amortization schedule, the September variable preferred rate of 1.195% gives a monthly payment of around 117,000 yen. Locking in Flat35 at 3.460% pushes that to about 164,000 yen—an extra 37,000 yen per month, or 444,000 yen per year.
This is the "certainty premium" between variable and fixed. Before long-term yields broke above 2%, the premium was modest. Now it has widened to a level that ordinary households cannot ignore. Flat35 conditions show that the rate climbs to 3.570% when LTV exceeds 90%, and the Flat50 (terms of 36-50 years) reaches 3.700%. Both indicate that the higher the down payment, the lower the cost of fixing the rate at the edge.
Does the Yield Spread Still Exist?
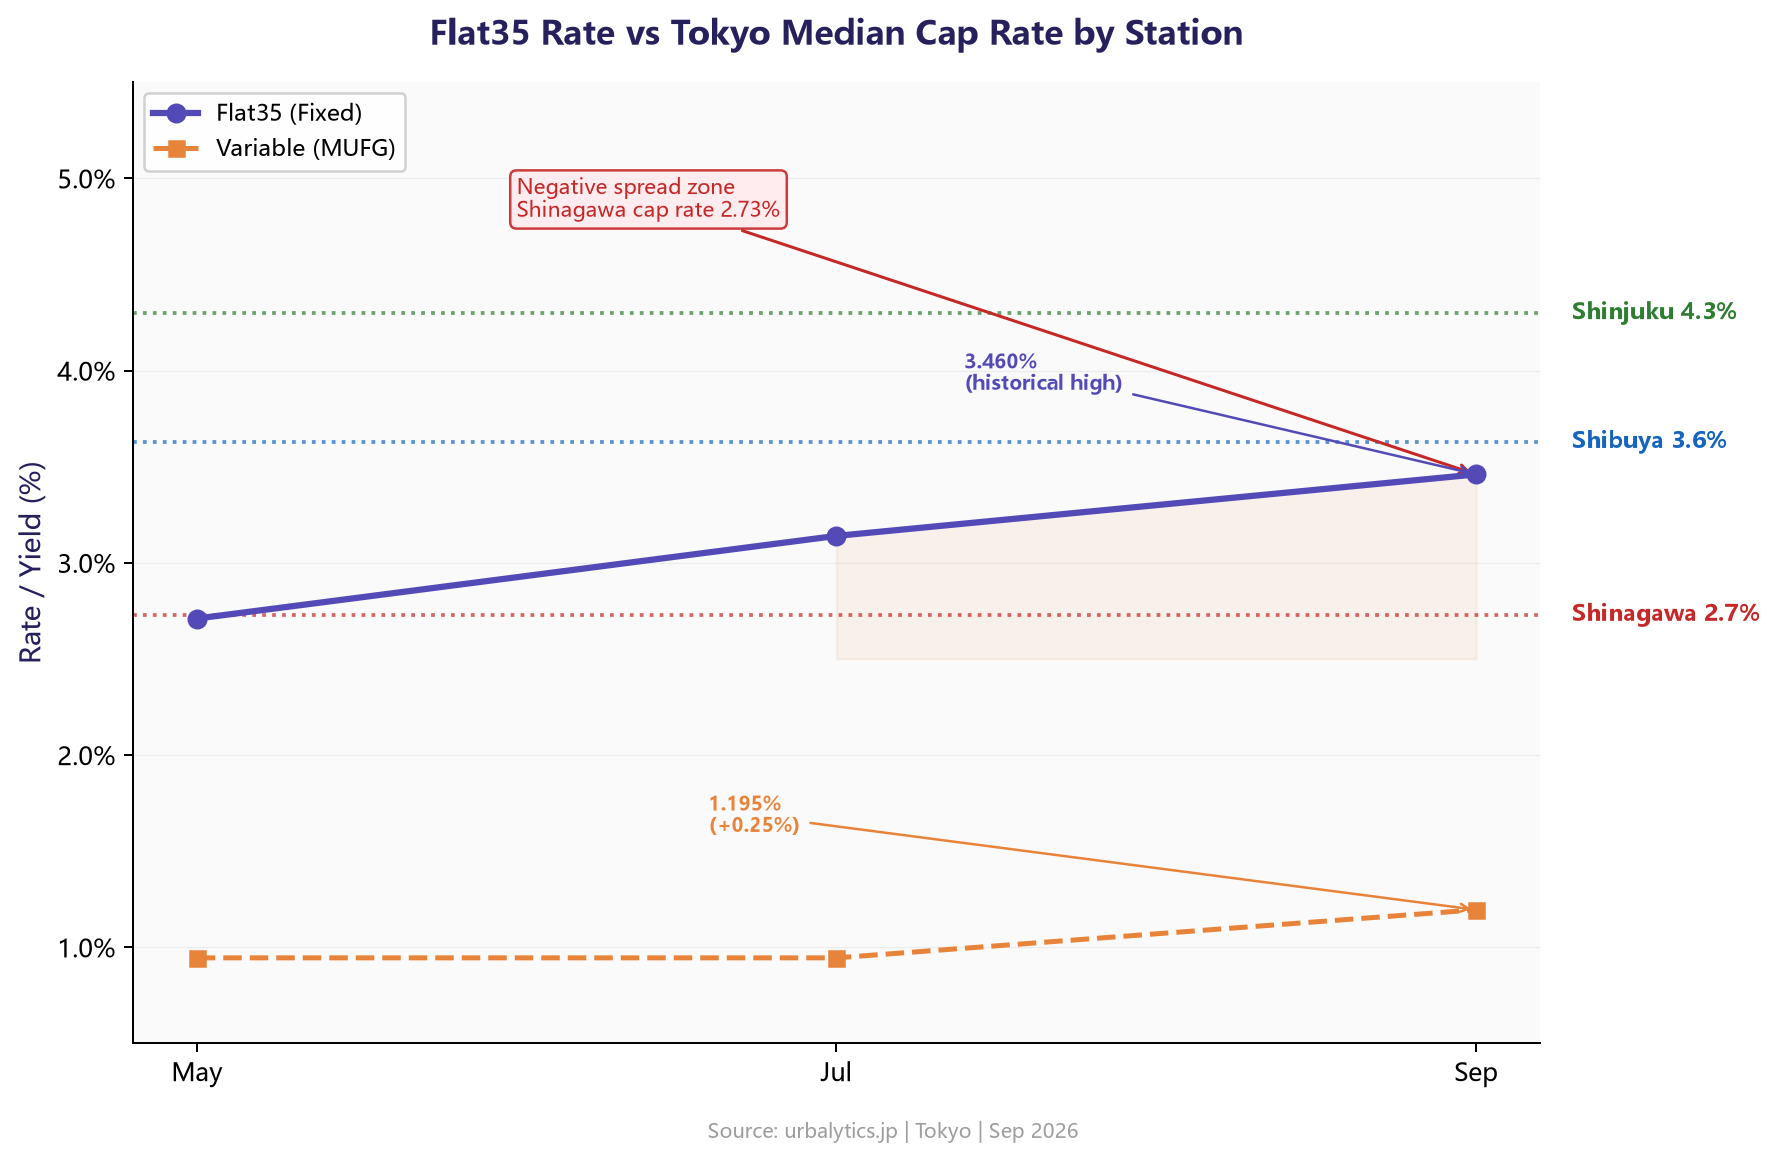
The transmission of rising rates to real estate investors depends on the income side of the equation—the cap rate (annual net income divided by asset price). urbalytics's station-level cap rate statistics (latest September 2026) show that median cap rates at major Tokyo hubs display a clear gradient: Shinjuku 4.30% (31 samples), Shibuya 3.63% (57 samples), Shinagawa 2.73% (4 samples).
Placing Flat35's 3.46% on the same chart reveals an interesting phenomenon. The 0.84 percentage point positive spread between Shinjuku's 4.30% and Flat35's 3.46% means that even fully financed with Flat35, the median Shinjuku asset can still generate positive returns on paper. The 0.17 percentage point spread between Shibuya's 3.63% and Flat35's 3.46% is critical—almost exactly at the boundary. Meanwhile, Shinagawa's 2.73% already sits below Flat35's 3.46%, meaning that financing a Shinagawa-area property with Flat35 would have on-paper income unable to cover the financing cost.
This comparison requires three caveats. First, cap rate is gross yield before deducting management fees, repair reserves, fixed asset tax, and other holding costs. After deductions, net yield typically falls another 1 to 1.5 percentage points. Second, Shinagawa's sample size is only 4, statistically weaker than Shinjuku's 31 and Shibuya's 57. Third, the Flat35-cap rate comparison ignores principal repayment—cap rate measures cash flow income, while Flat35 monthly payments include both interest and principal.
Variable vs Fixed: The Current Decision Framework
In the current environment, the choice between variable and fixed needs to shift from "which number is lower" to "which number is more stable." Variable rates in September sit in the 1.195% (MUFG) to 1.525% (SMBC) range, having moved up overall from the 0.945%-1.275% range at the start of the year. The BoJ policy rate at 1.25% is now in effect, and the probability of further adjustment at upcoming policy meetings (there are several remaining in 2026) is not low. The Norinchukin Research Institute forecasts the policy rate to rise to 1.5% around June 2027.
Choosing variable is therefore making a judgment call: how likely is the policy rate to rise another 25 to 50 basis points over the next 12 to 18 months? If you judge it "still rising," variable means the payment jumps from some point next year. If you judge "close to peak," the current low variable advantage can persist for a while longer.
One change in September is that 2 of 5 major banks raised variable rates while 3 held steady—indicating pricing divergence among banks rather than uniform industry action. For buyers considering variable, this September episode shows that future variable rate hikes will not happen in lockstep across all institutions, but may continue in 2-of-3 batches.
The fixed side follows a different logic. Flat35 at 3.46% is a historical high, primarily driven by the long-term JGB yield at the 3% level. If fiscal conditions ease and overseas tightening pace changes, the long-term yield could fall, taking Flat35 with it. But if inflation stays above 2% and fiscal expansion continues, long-term yields remain above 3% or rise further—locking in Flat35 now means locking in a relative low.
Three Decision Rules for Now
First, Flat35 is at a historical high. The next key indicator to watch is the 10-year JGB yield. This yield touched 2.900% in July 2026, fell to 2.685% in August, broke through 3.000% again on September 1, and closed at 2.990% on September 17. If October stays below 3%, Flat35 will likely see a small pullback. If it continues upward, Flat35 will follow.
Second, the core question for variable rate choice is "can the household income absorb the payment after a rate hike?" For the September variable rate of 1.195% rising to 2.0% (hypothetical): on a 40 million yen, 35-year loan, monthly payments rise from 117,000 yen to 132,000 yen, an increase of 15,000 yen per month. Whether you can absorb that is the core question.
Third, the granularity of cap rate data matters more than the Flat35 number itself. The nearly 1 percentage point gap between Shinagawa's 2.73% and Shibuya's 3.63% determines whether the investment side still has room in a rising-rate environment. Using urbalytics's cap rate statistics, you can break this down by station, building type, and year. The cap rate gradient by sample year at Shibuya Station and Shinjuku Station also differs from each other.
One-Sentence Judgment
The combination of September Flat35 at 3.46% and variable rates at 1.195%-1.525% means that real estate investors are facing a dual environment of "rate costs at decade highs, with cap rates varying by location." In areas where the Flat35-nominal spread is near zero or negative (like Shinagawa), prioritize variable financing while preparing for payment volatility. In areas where the positive spread is still thick (like Shinjuku), whether to lock Flat35 depends on the view of long-term JGB yield direction. Station-level cap rate data is the starting point for this judgment. urbalytics station-level data is the tool for tracking these indicator changes.
Data sources: housingloan-navi "住宅ローン金利の動向と見通し【2026年9月】" (updated September 26, 2026), housingloan.jp "住宅ローンの金利動向(2026年9月更新)", Sumamoge "【2026年9月】住宅ローン金利はいくら?" (published September 2026), urbalytics.jp rent_stats and building_cap_rate_stats (latest September 2026 samples). This article does not constitute investment advice.
Copyright: This article is original content by the author. Please do not reproduce, copy, or quote without permission. For usage requests, please contact the author or this site.