Words: 1282 | Estimated Reading Time: 7 minutes | Views: 127
Studio rents in the 23 wards hit a new high of ¥114,000, but faster growth is occurring in outer Tokyo and neighboring prefectures. Rental inflation across Greater Tokyo has shifted from the urban core to the periphery.
On September 28, the real estate information site アットホーム (At Home) released rental data for August 2026 covering the Greater Tokyo area. In Tokyo’s 23 wards, the average asking rent for studios under 30 m² reached ¥114,339, up 10.0% year over year, the highest since the series began in January 2015.
Coverage the same day also highlighted two other numbers: studios in Kanagawa Prefecture at ¥82,600, up 11.8% y/y; and Saitama Prefecture at ¥72,600, up 10.9%—both record highs.
At a glance, this looks like yet another “Tokyo rents are too high” headline. But a closer read of At Home’s original report shows what investors should focus on this time: the distribution of growth has changed.
1) The numbers: all four size bands in the 23 wards set new records
At Home measures “rent + management/common fees” and segments units by size into four bands: studios (<30 m²), couples (30–50 m²), family (50–70 m²), and large (70 m²+).
In August 2026, rental condominiums across the 23 wards set new highs since 2015 in all four bands. Couples units averaged ¥185,268, marking a 15th consecutive record; family units ¥263,469; large units ¥423,559.
On an index with January 2015 = 100, studio rents in the 23 wards have reached 140.4. In other words, the same compact unit now asks about 40% more than eleven years ago, with nearly one-third of that gain concentrated in the past 12 months.
This indicates the rent upcycle is broad-based, spanning studios through large formats—not confined to any one unit type.
2) Month-on-month lens: studio rent momentum in the 23 wards is easing
There’s an easy-to-miss detail. In July, studio rents in the 23 wards saw their first m/m decline in 26 months. August rebounded, but only by 0.2% m/m—just ¥192.
By contrast, in August large units rose 1.7% m/m and family units 1.4% m/m. Smaller units appear near tenant affordability ceilings, slowing their ascent; larger formats continue to catch up.
At Home’s analysis reaches a similar conclusion: core-area rents remain elevated, with some demand shifting to surrounding areas and lifting overall levels. Growth rates are narrowing, but a high plateau is likely to persist.
For investors focused on small units in the 23 wards, this means the room to absorb high entry prices via rent growth is narrowing. The “pay up now, let rents catch up” playbook of the past two years now calls for more conservative underwriting.
3) The faster lane is outside the core: outer Tokyo, Kanagawa, Saitama
The real acceleration is beyond the 23 wards. By At Home’s y/y rankings for studios, two of the national top three are in Greater Tokyo: outer Tokyo at +11.9% and Kanagawa at +11.8%—both outpacing the 23 wards’ +10.0%.
The pattern is even clearer for couples and family units. In outer Tokyo, couples units rose 13.7% y/y, the highest among 13 surveyed regions; family units gained 10.2%, also No. 1. In Chiba Prefecture, family units ranked third at 9.3%.
By comparison, family units in the 23 wards rose only 6.5% y/y. Core-city families are trading space against budget, pushing demand to the outer commuter belt.
The implication is clear: a “high-plateau phase” in the 23 wards is coinciding with an “acceleration phase” in the periphery. The main battleground for rent growth is shifting from inside the Yamanote Line to core stations 30–60 minutes out.
4) Urbalytics data: rent gaps and cap-rate gaps are not symmetrical
To map At Home’s area averages to specific stations, we used Urbalytics listings for rentals and whole-building income properties to compare four representative station areas: Shinjuku (23 wards), Tachikawa (outer Tokyo), Kawasaki (Kanagawa), and Omiya (Saitama).
For rentals under 30 m², the median asking rent per m² was ¥5,431 around Shinjuku Station (n=115), ¥3,992 in Kawasaki (n=500+), ¥3,286 in Omiya (n=267), and ¥3,267 in Tachikawa (n=300).
At the same stations, the median listed cap rate for whole-building income properties was 4.30% in Shinjuku (n=31), 6.05% in Tachikawa (n=95), and 6.30% in both Kawasaki and Omiya (n=123, n=99).
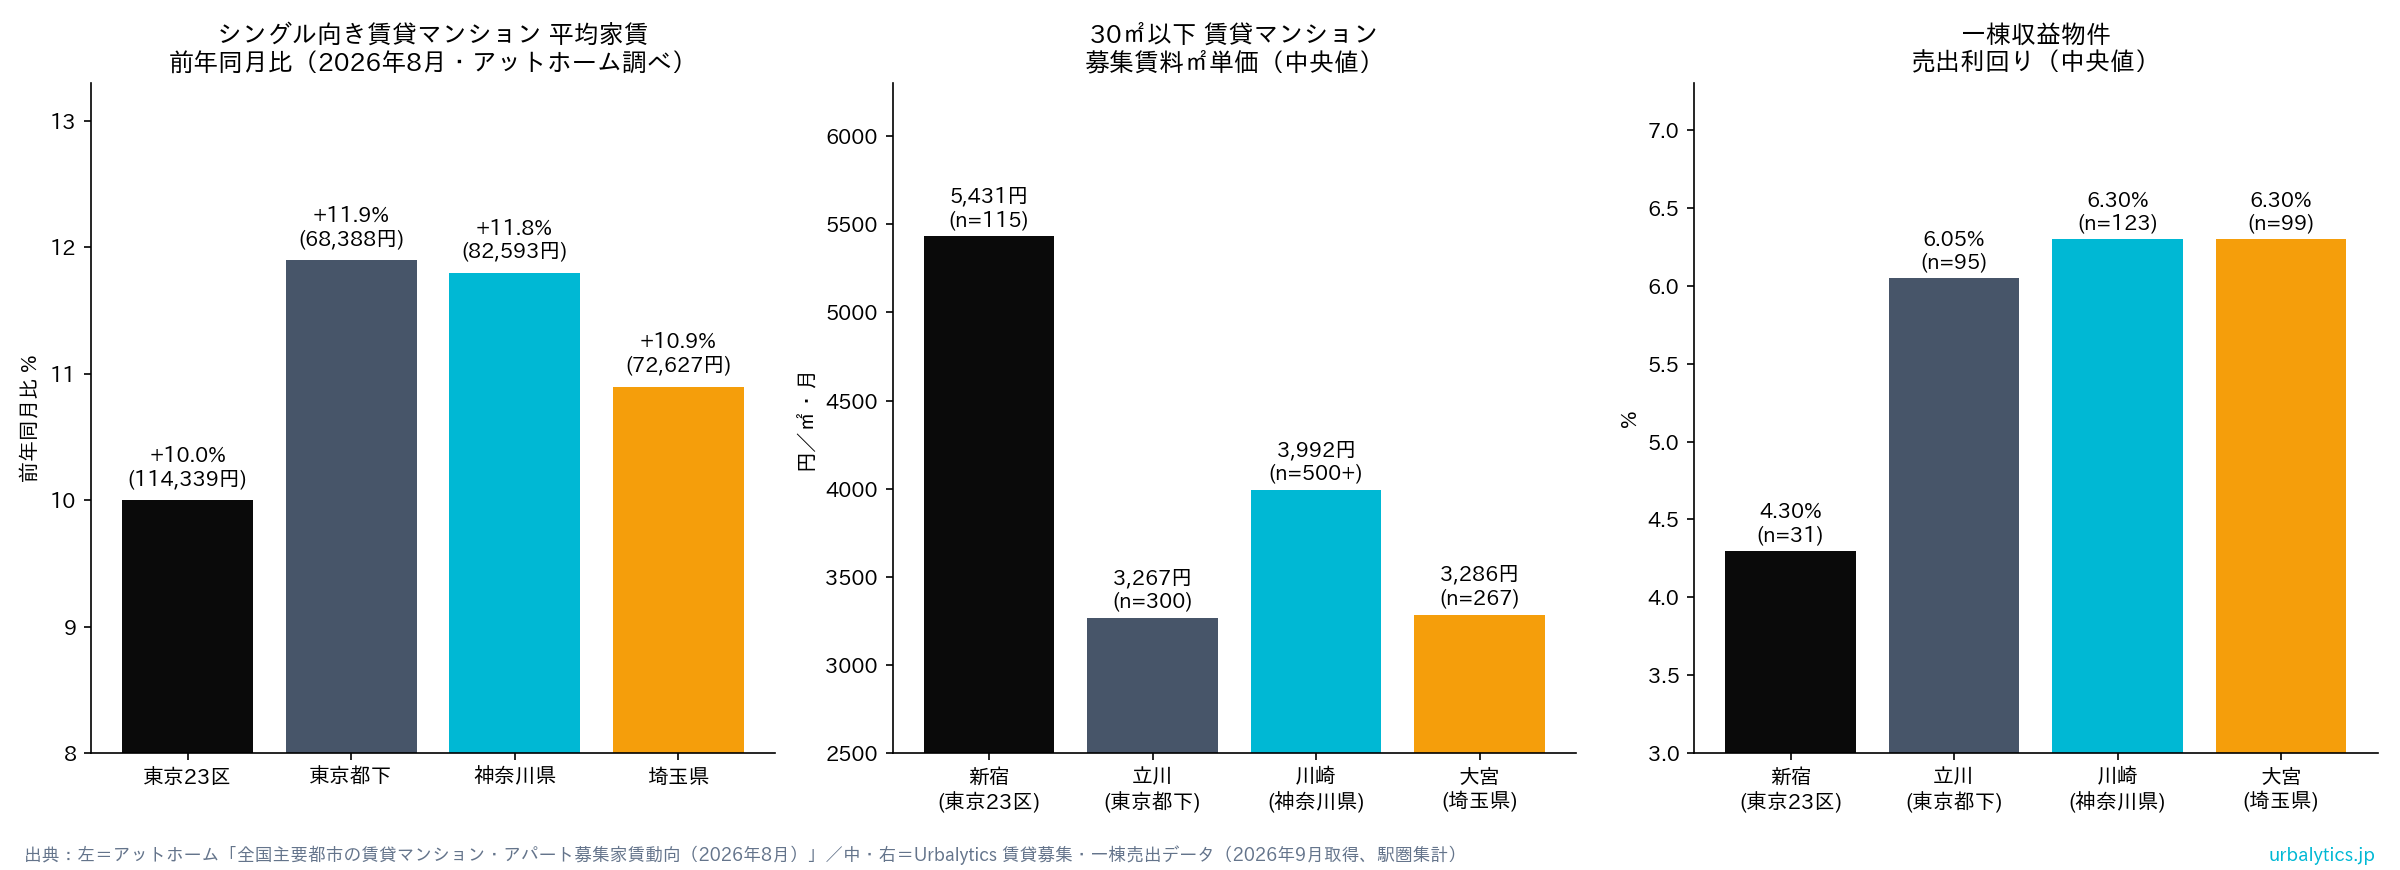
Urbalytics Insight Studio rent per m² in Shinjuku is roughly 1.65x Omiya’s, yet whole-building cap rates are a full 2 percentage points lower. Outer-core stations are seeing faster rent growth and higher cap rates—pricing has not fully reflected this spillover demand.
Note that listings reflect asking, not achieved, prices; and Shinjuku’s whole-building samples include many commercial-use properties. Use these for direction, not precision pricing.
Explore rent distributions by area in Urbalytics’ Kawasaki Ward Rental Condominium Market Report, Omiya Ward Rental Condominium Market Report, and Tachikawa City Rental Condominium Market Report. As a core-area benchmark, see the Shinjuku Ward Rental Condominium Market Report.
5) What this means for investors
A record-high rent is not, by itself, a buy signal; what matters is where it is happening and at what slope. Three takeaways from this data:
First, small units in the 23 wards are entering a “high-level flattening” phase. Rents are unlikely to fall, but the odds of continued double-digit growth are diminishing. When buying at today’s cap rates, stress-test for flat to slightly lower rents.
Second, core outer stations are in a “catch-up” phase. Commuter hubs such as Kawasaki, Omiya, and Tachikawa are seeing faster rent growth than the 23 wards and cap rates roughly 200 bps higher—making them prime beneficiaries of the spillover.
Third, product mix matters more than postcode. In outer Tokyo and neighboring prefectures, couples and family units are leading—signaling that the migrating demand is budgeted households needing more space, not just students chasing cheaper studios.
Risk reminders Higher cap rates in the periphery come with higher vacancy and repair risk. If core-city rents peak and demand recedes, older small units in the suburbs may be first to come under pressure. Before buying, verify supply pipelines and net in-migration station by station.
From a longer vantage point, Greater Tokyo’s rent upcycle has already run for more than two years. As core-area rents near ceilings, the periphery’s relative value stands out, and this diffusion dynamic is likely to persist for a while.
For cross-border investors, rather than chase small units in the 23 wards where cap rates have been compressed to just over 4%, widen the lens to core stations within a one-hour commute and compare, one by one, rent growth, cap rates, and liquidity.
For how rent volatility impacts short-stay versus long-term returns, see our earlier analysis: Shinjuku Minpaku Regulation and the Divergence Within Tokyo’s 23 Wards.
#TokyoRents #Tokyo23Wards #StudioApartments #JapanRentGrowth #RentalCondominiums #KanagawaRealEstate #SaitamaRealEstate #Kawasaki #Omiya #Tachikawa #CapRate #JapanRealEstateInvestment #GreaterTokyoRentalMarket #AtHome #Urbalytics
Sources
- At Home Co., Ltd., “Asking Rent Trends for ‘Rental Condominiums and Apartments’ in Major Cities Nationwide (August 2026)”, 2026, https://www.athome.co.jp/corporate/news/data/market/chintai-yachin-202608/
- At Home Co., Ltd., Press Release (PR TIMES), 2026, https://prtimes.jp/main/html/rd/p/000000770.000051123.html
- TBS NEWS DIG, “Average studio rent in Tokyo’s 23 wards hits a record ¥114,339 in August; Kanagawa and Saitama also rise over 10% y/y” (Yahoo! News), 2026, https://news.yahoo.co.jp/articles/7dbbfc6f432c741b66415fea5269d0ca9a40eb0f
- Urbalytics Market Report, Kawasaki Ward, Rental Condominiums, 2026, https://www.urbalytics.jp/market/area/kanagawa/kawasaki-ku/mansion
- Urbalytics Market Report, Omiya Ward, Rental Condominiums, 2026, https://www.urbalytics.jp/market/area/saitama/omiya-ku/mansion
- Urbalytics Market Report, Tachikawa City, Rental Condominiums, 2026, https://www.urbalytics.jp/market/area/tokyo/tachikawa-shi/mansion
- Urbalytics Market Report, Shinjuku Ward, Rental Condominiums, 2026, https://www.urbalytics.jp/market/area/tokyo/shinjuku-ku/mansion
Copyright: This article is original content by the author. Please do not reproduce, copy, or quote without permission. For usage requests, please contact the author or this site.